Active vs Passive Investing
The Foundational Debate in Portfolio Management
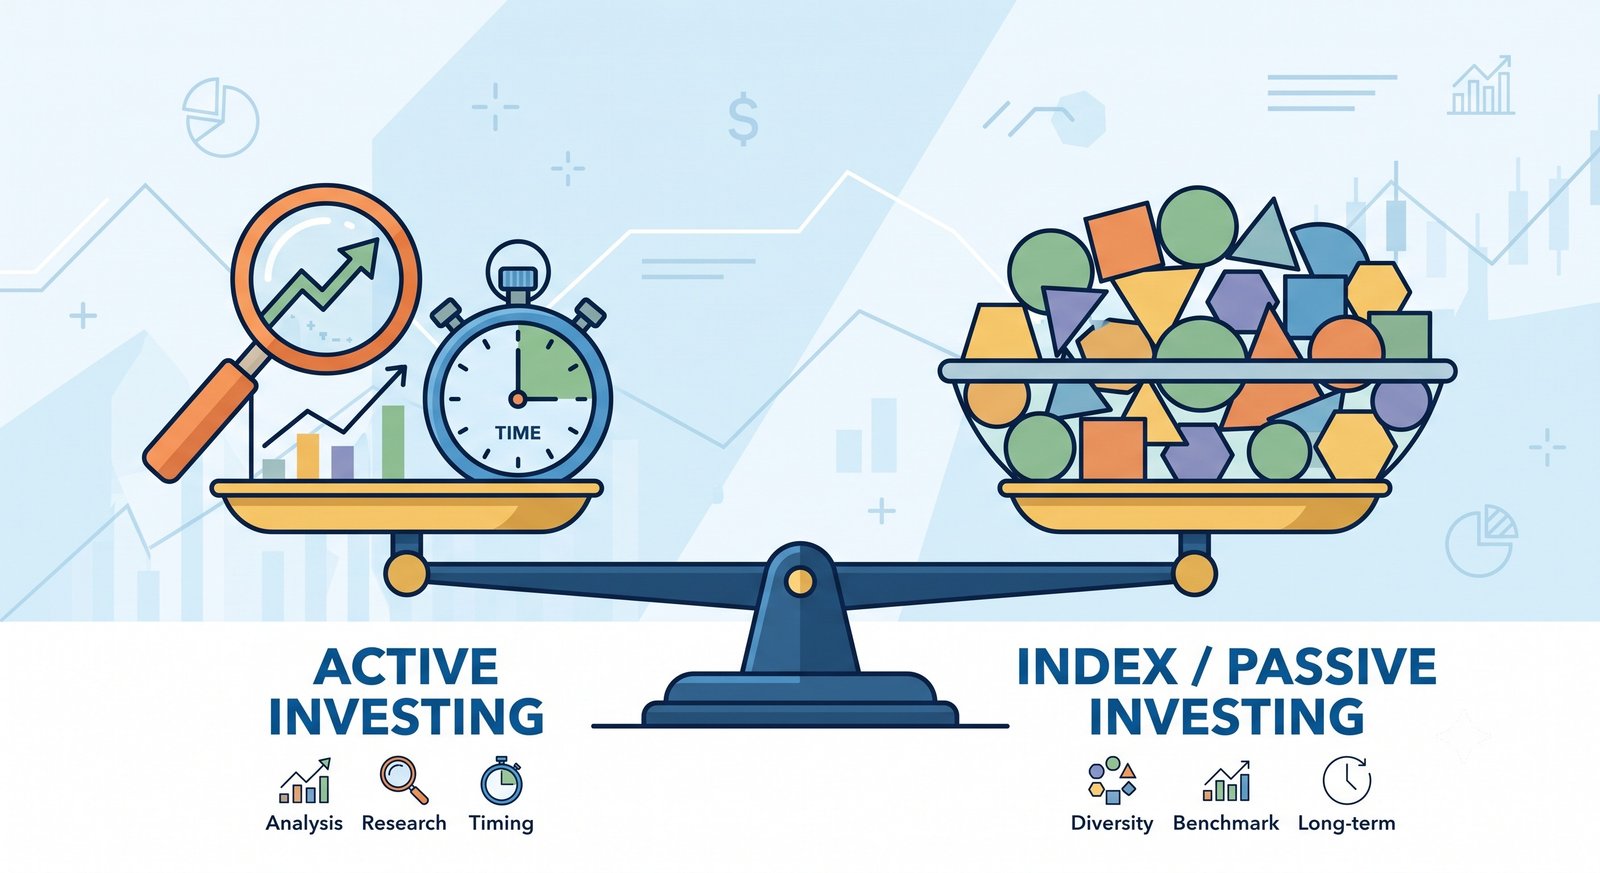
The dichotomy between active and passive investing represents the most consequential philosophical and mathematical debate in modern finance. At its core, this divergence dictates how capital is allocated, how risk is managed, and how management fees erode long-term compounding. Active investing is the pursuit of excess returns—often referred to as "alpha"—through continuous research, market timing, technical analysis, and fundamental security selection. Its primary objective is to outperform a specific benchmark index. Conversely, passive investing abandons the pursuit of outperformance entirely. Instead, it seeks to replicate the returns of a specific benchmark by holding all, or a representative sample, of the securities within that index, operating on the macroeconomic premise that financial markets are broadly efficient over long time horizons.
Historically, the financial industry was exclusively active. It wasn't until 1975, when John Bogle launched the First Index Investment Trust (later the Vanguard 500 Index Fund), that passive investing was institutionalized for retail investors. Since then, trillions of dollars have migrated from active mutual funds to passive Exchange-Traded Funds (ETFs) and index funds. Understanding the mechanics, mathematical formulas, and ideal use cases for both methodologies is essential for constructing a robust, resilient portfolio capable of withstanding various macroeconomic cycles.
1. Theoretical Bedrock: The Efficient Market Hypothesis (EMH)
To comprehend why passive investing has gained such structural dominance, one must examine the Efficient Market Hypothesis (EMH), formulated by Eugene Fama in the 1970s. EMH posits that asset prices fully reflect all available information at any given time. Therefore, it is impossible to consistently achieve higher returns than the overall market through stock selection or market timing, because any new information that could impact a stock's valuation is instantaneously priced in by market participants.
- Weak Form EMH: Suggests that past price movements, volume, and earnings data do not affect a stock's future price. This form directly challenges technical analysis, asserting that momentum and chart patterns cannot consistently yield excess returns.
- Semi-Strong Form EMH: Argues that all publicly available information is already priced into equities. This challenges fundamental analysis, implying that dissecting public financial statements or corporate actions will not yield an edge, as institutional algorithms have already reacted.
- Strong Form EMH: The most extreme iteration, stating that all information—public and private (insider)—is accounted for in stock prices. If strong form EMH holds true, active management is an entirely futile endeavor.
While pure Strong Form EMH is heavily debated (as evidenced by market bubbles and irrational panics), the broad efficiency of large-cap markets makes consistent active outperformance statistically rare, especially after accounting for management fees and trading costs. This forms the intellectual foundation for passive investing.
2. Deep-Dive Explanations & Formulas: Alpha, Beta, and Active Risk
The debate between active and passive is deeply quantitative. Modern Portfolio Theory uses specific formulas to separate the returns generated by general market movements (Beta) from the value added by a manager's skill (Alpha).
The Capital Asset Pricing Model (CAPM): This formula establishes the expected return of an asset based on its systemic risk. Passive investors accept the CAPM expected return, while active investors seek to exceed it.
$$E(R_i) = R_f + \beta_i (E(R_m) - R_f)$$
Where $E(R_i)$ is the expected return of the investment, $R_f$ is the risk-free rate, $\beta_i$ is the beta (volatility relative to the market), and $E(R_m)$ is the expected return of the market. The term $(E(R_m) - R_f)$ represents the equity risk premium.
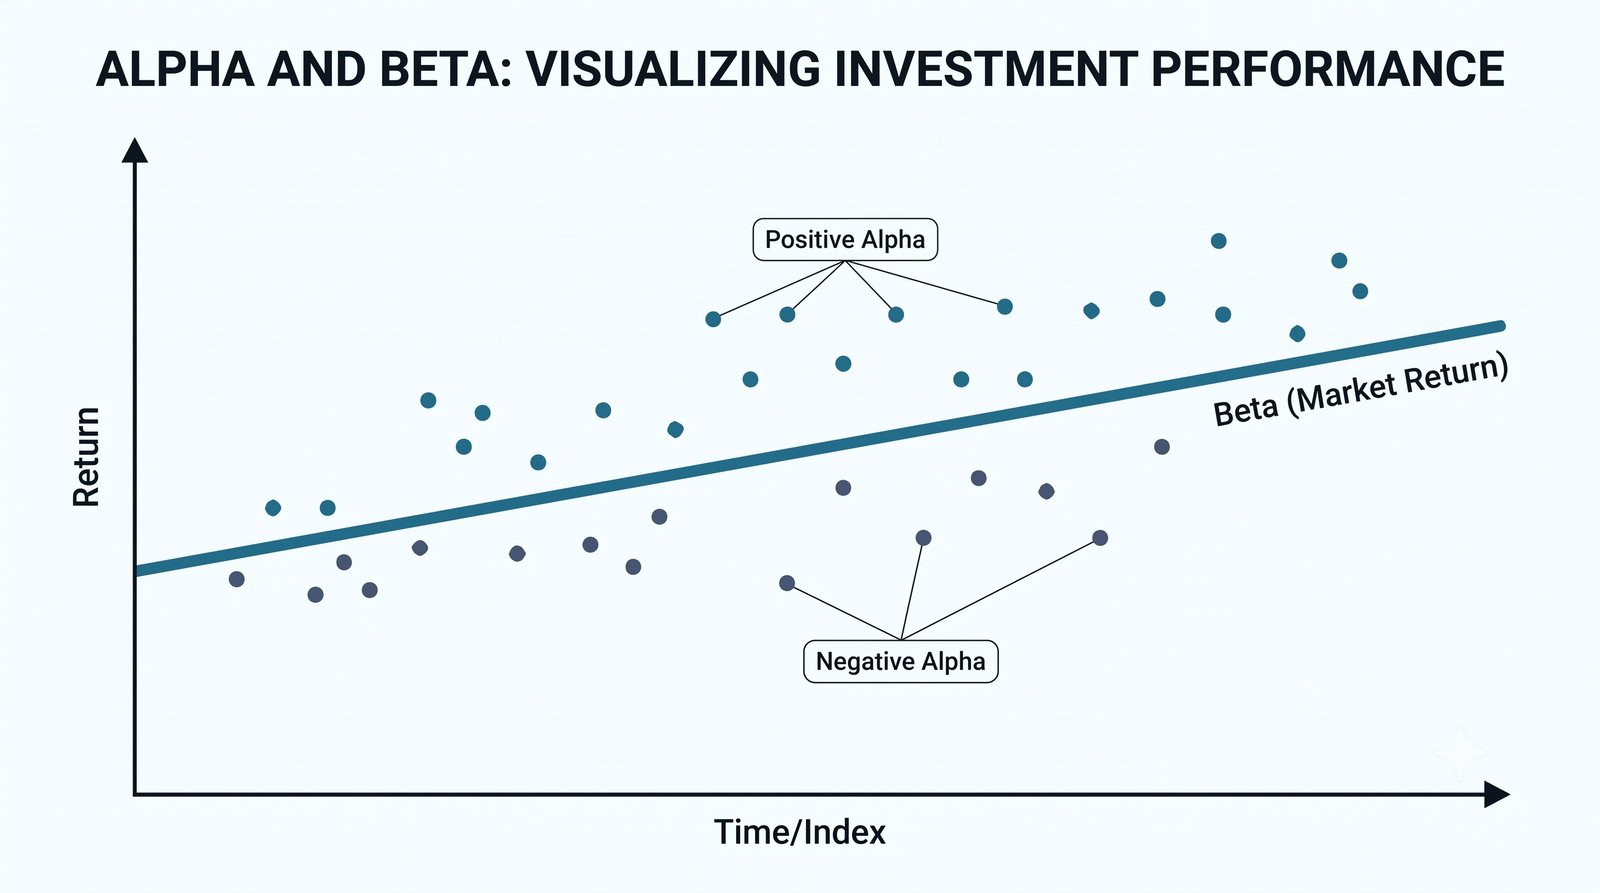
Jensen's Alpha ($\alpha$): This is the holy grail of active management. It represents the abnormal return of a portfolio over the theoretical expected return modeled by CAPM. A positive alpha indicates the manager has added value through superior stock selection or market timing.
$$\alpha = R_p - [R_f + \beta_p (R_m - R_f)]$$
Where $R_p$ is the actual portfolio return. If an active mutual fund charges a 1.5% expense ratio but generates an alpha of 0%, the investor has effectively lost 1.5% relative to a passive index fund.
Tracking Error (TE): Passive funds aim for a tracking error as close to zero as possible, while active funds inherently generate high tracking error as they deviate from the benchmark.
$$TE = \sqrt{\frac{\sum (R_{p,t} - R_{b,t})^2}{N-1}}$$
To evaluate if an active manager's tracking error (risk) is justified, institutional investors use the Information Ratio (IR), calculated as $\frac{\alpha}{TE}$. A higher Information Ratio means the manager is generating more excess return for every unit of active risk taken.
3. The Mechanics of Passive Investing
Passive investing is operationalized through Index Funds and ETFs. These vehicles do not employ research teams to forecast earnings or predict macroeconomic shifts. Instead, they use algorithms to blindly replicate the exact weighting of a predetermined index, such as the S&P 500 or the Nifty 50.
Most passive funds utilize Capitalization-Weighted methodology. As a company's market capitalization grows (price multiplied by outstanding shares), the passive fund mechanically buys more of it. As a company shrinks, the fund sells it. This creates a powerful momentum effect: winners are automatically rewarded with more capital inflows, and losers are organically purged from the index. This self-cleansing mechanism avoids "survivorship bias" and ensures the investor always owns the largest, most dominant corporations in the economy.
The primary advantage of passive mechanics is structural cost efficiency. Because there is no active trading or highly compensated analyst teams, the Total Expense Ratio (TER) of passive funds is often close to zero (e.g., 0.03% to 0.10% annually). Over a 30-year compounding horizon, the mathematical difference in terminal wealth between a 0.05% passive fee and a 1.5% active fee is staggering, often accounting for hundreds of thousands of dollars in foregone wealth.
4. The Mechanics of Active Investing
Active management relies on human intuition, proprietary algorithms, and exhaustive research to exploit market inefficiencies. Active managers believe that markets frequently misprice assets due to behavioral panic, institutional constraints, or a lack of liquidity.
- Fundamental Analysis: Dissecting balance sheets, cash flow statements, and macroeconomic data to find intrinsic value. If an active manager calculates a company's intrinsic value at ₹1,500 but it is trading at ₹1,000, they will actively overweight this asset in their portfolio.
- Technical and Quantitative Analysis: Utilizing price velocity, moving averages, open interest data, and statistical arbitrage. High-frequency and intraday active traders rely heavily on these metrics, scanning derivatives segments to capitalize on micro-inefficiencies before the broader market reacts.
- Tactical Asset Allocation: Active investing isn't just about picking individual stocks; it also involves actively shifting weightings between asset classes (e.g., moving from equities to cash ahead of a forecasted recession).
5. Structured Comparison: Analyzing Active vs Passive
The choice between methodologies heavily dictates an investor's tax liability, time commitment, and risk profile. The table below outlines the core structural differences.
| Metric | Passive Investing | Active Investing |
|---|---|---|
| Primary Objective | Match benchmark returns exactly. | Outperform benchmark returns (generate Alpha). |
| Cost Structure (TER) | Extremely low (often 0.05% - 0.20%). | High (typically 0.75% - 2.00% + performance fees). |
| Tax Efficiency | High. Low portfolio turnover minimizes capital gains distributions. | Lower. Frequent buying/selling triggers short-term capital gains taxes. |
| Market Environments | Excels in large-cap, highly efficient bull markets. | Potential to shine in volatile, bearish, or inefficient niche markets (e.g., small-cap, emerging markets). |
6. Realistic Case Studies
To contextualize the debate, we examine two practical scenarios demonstrating the extreme ends of the active and passive spectrums, and how specific financial instruments are matched to these strategies.
- Case Study 1: The Tactical Intraday Trader (Hyper-Active)
Profile: Arjun manages a highly concentrated, short-term portfolio. He operates as an active intraday trader focusing exclusively on the Nifty 50 and the Futures & Options (F&O) segments.
Execution: Arjun does not care about fundamental corporate balance sheets or long-term GDP growth. His active strategy relies entirely on identifying micro-inefficiencies through technical analysis. He utilizes a strict demand and supply zone strategy, scanning for rapid open interest changes and price velocity anomalies at critical support levels. When institutional flow triggers a supply zone, he actively shorts the index. His tracking error against a buy-and-hold benchmark is massive, and his tax liability is entirely classified as speculative short-term gains. However, by strictly managing his position sizing and stop-losses, his hyper-active methodology aims to extract consistent, uncorrelated absolute returns regardless of the broader macroeconomic trend. - Case Study 2: The Systematic Wealth Preserver (Pure Passive)
Profile: Meera is structuring a multi-decade retirement portfolio. Her primary objective is capital preservation, inflation protection, and generating a reliable baseline for a future Systematic Withdrawal Plan (SWP).
Execution: Meera employs a purely passive framework across a diversified asset allocation model. Her portfolio is distributed across broad-market equity mutual funds (tracking large-cap and mid-cap indices), debt mutual funds for fixed-income stability, and liquid mutual funds for immediate cash flow needs. She anchors her structural safety with government-backed vehicles like the Employees' Provident Fund (EPF), the National Pension System (NPS), and physical gold. By utilizing index-based vehicles, Meera eliminates the idiosyncratic risk of individual stock picking. She mechanically rebalances once a year, allowing the massive cost savings from low expense ratios to compound uninterrupted over 25 years. When her SWP begins, she can draw down mathematically predictable amounts without worrying about a star fund manager suddenly underperforming.

7. Actionable Strategy Guide: Implementing a Core-and-Satellite Approach
Investors do not need to choose a fundamentalist side in the active vs. passive debate. Institutional wealth managers frequently combine both methodologies using a "Core and Satellite" framework. This strategy provides the structural stability of passive indexing with the Alpha-generating potential of active management.
- Step 1: Establish the Passive Core (70% - 85% of Portfolio). Allocate the vast majority of your capital to ultra-low-cost, broad-market index funds or ETFs. This core should cover major asset classes: domestic equities, international equities, and aggregate bonds. This guarantees that you will capture the baseline economic growth and compound efficiently without excessive fees.
- Step 2: Identify Inefficient Markets for Active Satellites (10% - 20%). Do not deploy active strategies in highly efficient markets like US Large-Cap tech, where beating the index is statistically improbable. Instead, use active managers or individual stock selection in highly specialized, less liquid, or inefficient sectors. Examples include emerging market small-caps, distressed debt, or highly technical derivatives strategies (like demand/supply zone intraday trading).
- Step 3: Cap Your Speculative Allocation (Max 5%). If you desire to actively trade individual equities based on personal conviction or thematic trends (e.g., AI or biotechnology), restrict this to a strictly defined, ring-fenced percentage of your net worth. This protects your mathematical risk capacity while satisfying the psychological risk tolerance for active engagement.
- Step 4: Monitor the Information Ratio. Annually review your active satellite positions. Because you are paying higher fees or spending significant personal time managing these assets, demand accountability. If an active position fails to generate consistent Alpha over a 3-year rolling period (evidenced by a low Information Ratio), liquidate the position and fold the capital back into the passive core.
Frequently Asked Questions
Q: Do active funds perform better during bear markets or recessions?
Theoretically, active managers have the flexibility to raise cash, short stocks, or shift into defensive sectors during a downturn, whereas a passive fund must ride the index all the way down. However, empirical data (such as the SPIVA scorecards) consistently shows that a majority of active managers still fail to beat their respective benchmarks even during bear markets, largely because timing the exact top and bottom of a recession is exceptionally difficult.
Q: Is passive investing creating an "Index Bubble"?
This is a prominent theoretical concern. Critics argue that because passive funds blindly buy the largest companies without analyzing their fundamental valuations, massive capital inflows disproportionately inflate the prices of mega-cap stocks, creating dangerous market concentration. While concentration risk is a valid concern, price discovery is still driven by active institutional traders setting the marginal price at the edges. Until passive ownership approaches near-total market dominance, price efficiency remains largely intact.
Q: Why are fees so detrimental in active management?
Fees do not just reduce your return in a single year; they destroy the compounding effect over decades. If a market returns 8% and an active fund charges 2%, the investor keeps 6%. Over 30 years, that 2% annual drag will consume nearly half of the portfolio's potential terminal wealth compared to a zero-fee alternative. Active managers must not only beat the market, but beat it by a margin greater than their fees, taxes, and trading costs combined, year after year.
Q: Can I use active strategies inside tax-advantaged accounts?
Yes, and in fact, it is structurally preferable. Because active trading generates significant short-term capital gains and dividend distributions, housing active strategies within tax-sheltered retirement vehicles (like the NPS or specific tax-deferred wrappers) shields the frequent trading activity from immediate tax friction, allowing gross returns to compound more efficiently.
See also
- Loading related topics...