Bull and Bear Markets
The Macroeconomic Pendulum of Capital Allocation and Sentiment
The financial markets are not static; they exist in a continuous state of flux, oscillating between periods of aggressive expansion and violent contraction. These macro-cycles are universally categorized into "Bull" and "Bear" markets. A Bull Market is characterized by sustained periods of rising asset prices, overarching economic optimism, high employment, and aggressive capital deployment. Conversely, a Bear Market is defined by a prolonged decline in asset prices, pervasive pessimism, economic contraction, and capital preservation. Understanding the structural mechanics, historical precedents, and mathematical definitions of these market regimes is critical for robust portfolio management and dynamic asset allocation.
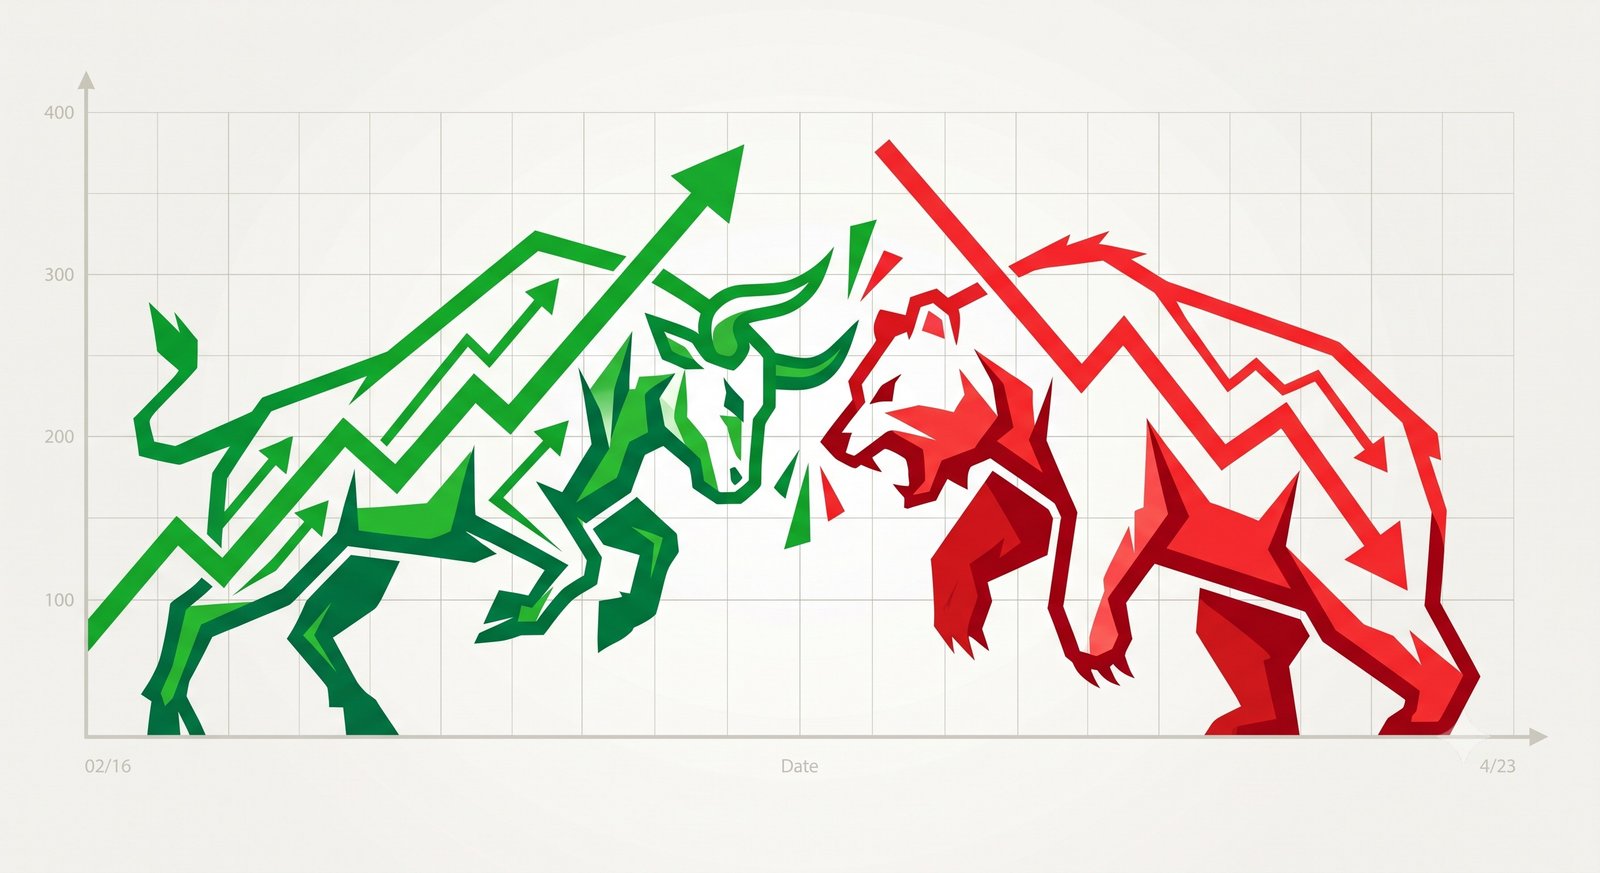
The etymology of these terms is rooted in the attack styles of the respective animals. A bull attacks by thrusting its horns upward into the air, symbolizing a market where prices are rising. A bear, on the other hand, attacks by swiping its paws downward, symbolizing a market where prices are falling. While traditionally applied to equities, these classifications are equally applicable to bonds, real estate, commodities, and digital assets.
1. Standard Technical Definitions and Classifications
While sentiment plays a massive role, financial institutions rely on rigid quantitative thresholds to classify market states. A mere dip in prices does not constitute a bear market, just as a brief rally does not define a bull market.
- The 20% Threshold: The universal technical threshold for a Bear Market is a 20% decline from the most recent 52-week peak in a broad market index (such as the S&P 500 or the Nifty 50). Conversely, a new Bull Market is technically confirmed when the index rises 20% from its lowest point (the trough) achieved during the bear market.
- Market Correction: A drop of 10% to 19.9% from a peak is classified as a "correction." Corrections are routine, healthy mechanisms that flush out excess speculation without damaging the structural integrity of the broader bull market trend.
- Secular vs. Cyclical Markets: A secular market is an overarching trend that can last from one to three decades, driven by massive demographic or technological shifts. A cyclical market is a shorter-term trend lasting a few months to a few years that occurs within the secular trend. For example, you can experience a cyclical bear market (a brief crash) within a broader secular bull market.
2. Macroeconomic Mechanics & Monetary Policy
Markets do not operate in a vacuum; they are derivative functions of the broader macroeconomic environment and central bank liquidity. The transition between bull and bear states is almost always catalyzed by shifts in monetary policy or systemic exogenous shocks.
The Mechanics of a Bull Market: Bull markets are engineered by expansionary monetary policy. When central banks lower interest rates, the cost of borrowing drops. Corporations take on cheap debt to fund share buybacks, aggressive R&D, and acquisitions, leading to surging earnings per share (EPS). Simultaneously, because low interest rates make fixed-income yields unattractive, investors are forced further out on the risk spectrum into equities to find returns, creating massive demand for stocks. This liquidity injection expands valuation multiples.
The Mechanics of a Bear Market: Bear markets are typically induced by contractionary monetary policy designed to fight inflation. When central banks raise the federal funds rate (or repo rate), the "risk-free rate" increases. Consequently, the discount rate applied to future corporate cash flows rises, immediately compressing equity valuations—especially for high-growth tech stocks. As borrowing becomes expensive, corporate profit margins shrink, layoffs occur, and unemployment rises. Margin calls force over-leveraged traders to liquidate positions regardless of price, creating a self-feeding downward spiral known as a liquidity trap.
3. Deep-Dive Explanations & Formulas: Quantifying Regimes
Quantitative analysts and portfolio managers utilize specific mathematical models to navigate, measure, and survive the severity of bear markets and the exuberance of bull markets.
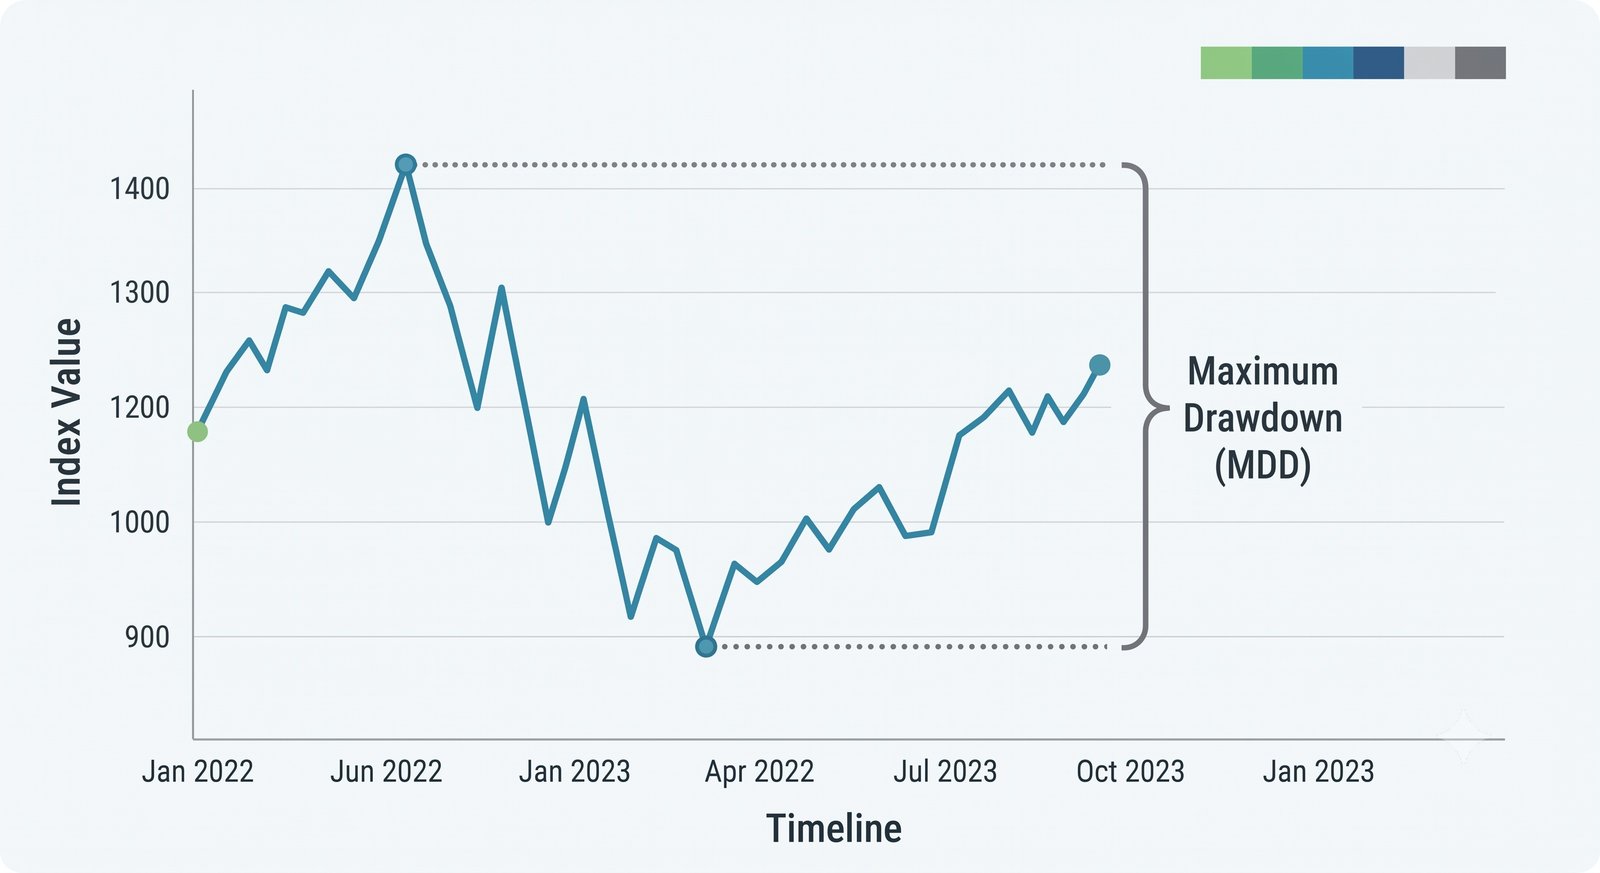
Maximum Drawdown (MDD): This formula is the quintessential measure of bear market severity. It calculates the maximum observed loss from a historical peak to a trough before a new peak is attained.
$$MDD = \frac{P - L}{P}$$
Where $P$ is the Peak value before the largest drop, and $L$ is the Lowest value (Trough) before a new high is established. A portfolio with a lower historical MDD demonstrates higher resilience against systemic shocks.
The Recovery Math (Asymmetry of Loss): Bear markets highlight a brutal mathematical asymmetry. If a portfolio drops by 50% during a bear market (e.g., $100,000 to $50,000), it does not need a 50% return to break even. It requires a 100% return to get back to the original peak ($50,000 * 2.0 = $100,000). The formula for the required return to recover a drawdown is:
$$Recovery_{Required} = \frac{1}{1 - MDD} - 1$$
This non-linear relationship is why capital preservation strategies during bear markets are often prioritized over aggressive growth.
Shiller P/E (CAPE Ratio): Developed by Nobel laureate Robert Shiller, the Cyclically Adjusted Price-to-Earnings ratio is used to determine if a bull market is fundamentally justified or merely a speculative bubble. It divides the current price of an index by the average of ten years of earnings, adjusted for inflation.
$$CAPE = \frac{Price}{Average_{10yr}(Earnings \times Inflation \ Adjustment)}$
Historically, when the CAPE ratio exceeds 30, it indicates that the bull market is statistically overvalued, and the probability of an impending cyclical bear market or deep correction is exceptionally high.
4. Structured Comparison: Identifying Market Regimes
The transition between markets is rarely announced on the day it happens. Investors must read the macroeconomic tea leaves. The following table contrasts the hallmark indicators of mature bull and bear markets.
| Economic Indicator / Metric | Mature Bull Market Characteristics | Deep Bear Market Characteristics |
|---|---|---|
| Volatility Index (VIX) | Low and stable (typically sub-15). High complacency. | Elevated and erratic (frequently 30+). Extreme panic. |
| Yield Curve | Normal/Steep (Long-term rates > Short-term rates). | Inverted (Short-term > Long-term), forecasting recession. |
| Corporate IPO Activity | Frenzied. Companies rush to list at exorbitant valuations. | Frozen. IPO window shuts down; capital dries up entirely. |
| Retail Investor Behavior | High leverage, FOMO (Fear of Missing Out), ignoring fundamentals. | Capitulation, mass liquidations, refusal to invest in equities. |
5. Realistic Case Studies: Tactics in the Trenches
How an investor interacts with bull and bear cycles depends entirely on their specific financial mandate and tactical time horizon. The following scenarios demonstrate how distinctly different methodologies interact with market volatility.
- Case Study 1: The Intraday Tactical Approach in a Bear Market
Profile: Vikram is an active intraday trader focusing on the Nifty 50 and the Futures & Options (F&O) segments. He employs a strict demand and supply zone strategy.
Scenario in Action: A systemic global shock triggers a cyclical bear market, causing the Nifty 50 to drop 22% over six weeks. Volatility (India VIX) spikes violently. While long-term investors are panicking, Vikram thrives. Bear markets feature aggressive, short-lived "bear market rallies." Vikram scans for top losers in the F&O segment, identifying heavily shorted stocks approaching historical supply zones. When price velocity hits these zones and rejects, he initiates highly leveraged intraday short positions. By strictly ignoring long-term fundamentals and trading pure price action—using stop-losses placed just above the supply zones—Vikram extracts absolute returns by riding the downward momentum, completely agnostic to the broader macroeconomic destruction. - Case Study 2: Defensive Capital Preservation (Sequence of Returns Risk)
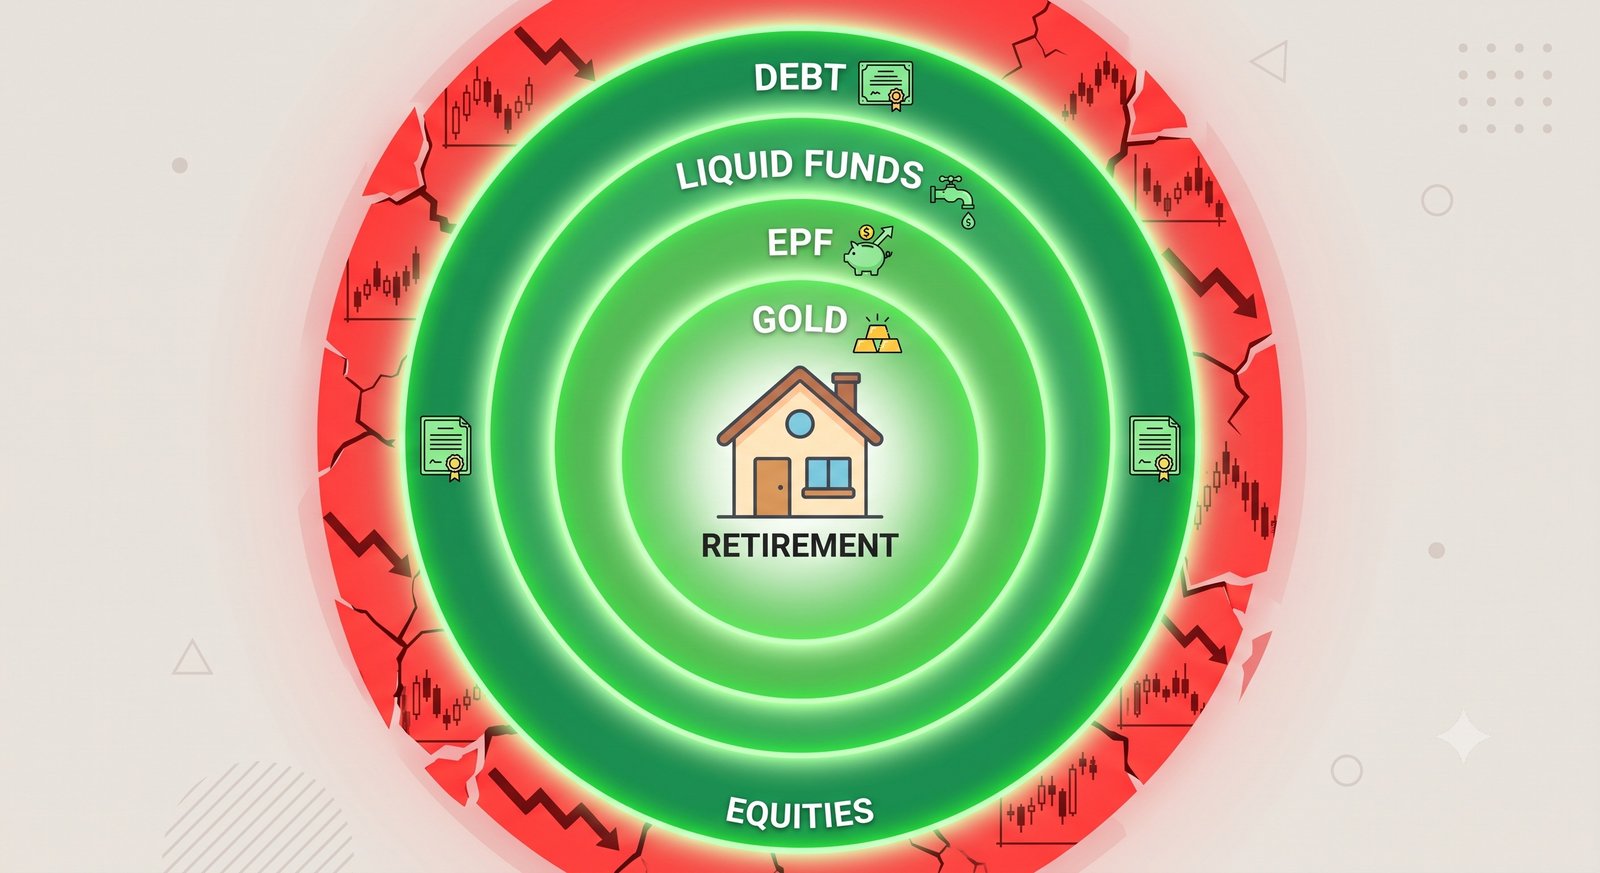
Profile: Ananya recently retired and relies on a long-term portfolio designed for a Systematic Withdrawal Plan (SWP). Her asset allocation spans equity mutual funds, liquid mutual funds, debt mutual funds, fixed deposits (FDs), physical gold, the Employees' Provident Fund (EPF), and the National Pension System (NPS).
Scenario in Action: Three years into retirement, a prolonged secular bear market begins. Her equity mutual funds shed 30% of their value. If she sells equities to fund her SWP, she will permanently impair her portfolio (Sequence of Returns Risk). Instead, Ananya executes a defensive bear market strategy. She temporarily halts all withdrawals from her equity mutual funds. She pivots her SWP to draw exclusively from her liquid mutual funds and fixed deposits. Concurrently, the non-correlated assets in her portfolio—specifically gold and the sovereign-backed EPF—provide a stabilizing floor to her net worth. This sophisticated compartmentalization allows her equity sleeve the necessary 3-to-4-year timeline required to mathematically recover from the drawdown without realizing permanent capital loss.
6. Actionable Strategy Guide: Navigating the Cycles
Surviving market cycles requires removing emotion and implementing a systematic, rules-based framework. Follow these steps to fortify a portfolio across all macroeconomic regimes.
- Step 1: Define the Policy Portfolio. Establish a strategic asset allocation grounded in your risk capacity. During euphoric bull markets, investors often convince themselves their risk tolerance is 100% equities. Anchor your strategy in a written Investment Policy Statement (IPS) to prevent behavioral drift when greed is pervasive.
- Step 2: Automate Rebalancing to Force "Buy Low / Sell High". Set a tolerance band (e.g., +/- 5%). In a roaring bull market, if equities inflate from a target 60% up to 65%, mechanically sell the 5% excess and buy underperforming bonds. In a bear market, if equities crash to 55%, sell bonds to buy the discounted equities. This systematically harvests volatility without requiring market timing.
- Step 3: Construct a Liquidity Buffer (Bear Market Defense). Ensure you hold 2 to 3 years of essential living expenses in zero-volatility instruments (short-duration debt funds or high-yield savings). This guarantees that you will never be forced to liquidate equity positions at the bottom of a bear market to pay for groceries or mortgages.
- Step 4: Shift Focus from Alpha to Beta. During the depths of a bear market capitulation, stock picking becomes highly dangerous due to bankruptcies and lack of visibility. Instead of trying to find the one company that will survive (chasing Alpha), deploy excess cash into broad-market index ETFs (capturing Beta) to guarantee participation in the eventual systemic recovery.
Frequently Asked Questions
Q: How long do bull and bear markets typically last?
Historically, there is a massive temporal asymmetry between the two regimes. Since 1928, the average bear market has lasted approximately 9 to 14 months, while the average bull market has endured for roughly 4 to 5 years (with some extending over a decade, such as the 2009-2020 run). The market takes the stairs up and the elevator down—meaning wealth destruction is rapid and violent, while wealth creation is slow and compounding.
Q: Is it possible to make money during a bear market?
Yes, but it requires sophisticated active strategies. Advanced traders utilize short selling (borrowing shares to sell high and buy back lower) or purchase put options, which increase in value as the underlying asset price drops. Additionally, fixed-income investors often see capital appreciation during bear markets as central banks eventually cut interest rates to stimulate the dead economy, driving existing bond prices upward.
Q: How can you definitively tell if a 15% drop is a correction or the start of a bear market?
You cannot know in real-time. This is the fundamental challenge of market timing. A 15% drop might reverse tomorrow and continue the bull run, or it might cascade into a 40% crash. Analysts look at leading macroeconomic indicators—like the yield curve inversion, manufacturing PMI drops, and rising credit default swap spreads—to gauge the probability of a recession, but there is no infallible predictive signal. This uncertainty is why strategic asset allocation and rebalancing are vastly superior to market timing.
Q: What is a "Bear Market Rally" or a "Dead Cat Bounce"?
A bear market rally is a sharp, brief increase in stock prices (sometimes surging 5% to 10% in a few days) occurring squarely within the broader downward trend of a bear market. They are notoriously violent and are primarily driven by short-sellers covering their positions (buying back stock) to lock in profits, rather than genuine fundamental buying. They routinely trap novice investors who believe the bottom is in, only for the broader market to resume its downward trajectory shortly after.
See also
- Loading related topics...