Diversification Strategies
The Mathematical Engine of Risk Mitigation and Portfolio Optimization
Nobel Laureate Harry Markowitz famously described diversification as "the only free lunch in finance." In the realm of investment fundamentals, diversification is the deliberate strategy of mixing a wide variety of investments within a single portfolio to mitigate exposure to any single asset or risk factor. The rationale behind this technique is that a portfolio constructed of different kinds of assets will, on average, yield higher long-term returns and pose a lower risk than any individual investment found within the portfolio.
However, true diversification extends far beyond the simplistic adage of "don't put all your eggs in one basket." Advanced diversification strategies require a deep understanding of macroeconomic mechanics, asset class correlations, geographic dispersions, and factor-based risk premiums. It is the architectural blueprint that defends a portfolio against idiosyncratic (company-specific) risk and dampens the blow of systematic (market-wide) volatility, ensuring wealth preservation across disparate economic cycles.

1. Deep-Dive Explanations & Formulas: The Mathematics of Diversification
To comprehend why diversification works, one must look at the mathematical underpinnings of Modern Portfolio Theory (MPT). The effectiveness of diversification is not measured by the sheer number of assets held, but by the covariance and correlation between those assets. When two assets behave differently under the same macroeconomic conditions, combining them reduces the portfolio's overall variance (risk) without necessarily proportionally reducing its expected return.
The Expected Return of a portfolio, E(Rp), is the weighted average of the expected returns of its individual components:
E(Rp) = w1R1 + w2R2 + ... + wnRn
However, the Portfolio Variance (risk), denoted as σp2, is where the "free lunch" occurs. For a two-asset portfolio, the formula is:
σp2 = w12σ12 + w22σ22 + 2w1w2σ1σ2ρ1,2
- Weights (w1, w2): The percentage of total capital allocated to each asset.
- Standard Deviation (σ1, σ2): The historical volatility or intrinsic risk of each asset.
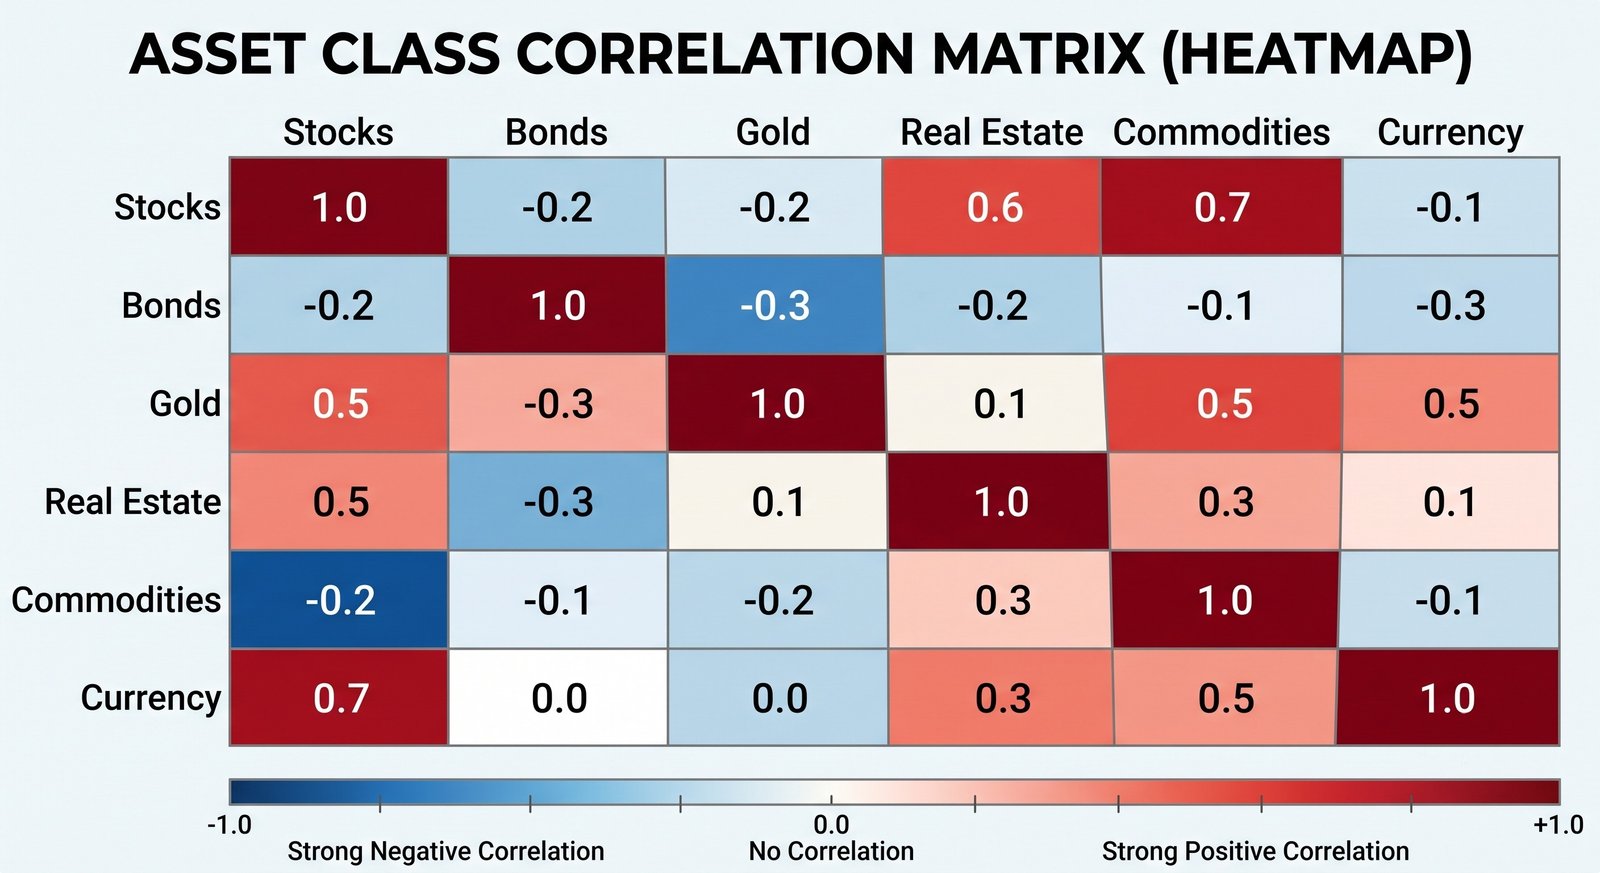
- Correlation Coefficient (ρ1,2): The critical variable. It measures how assets move in relation to one another, ranging from -1.0 to +1.0.
If two assets are perfectly positively correlated (ρ = 1), diversification provides no risk reduction benefit. If they are perfectly negatively correlated (ρ = -1), risk can theoretically be eliminated. In reality, most assets have a correlation between 0 and 0.8. As long as ρ is less than 1, the third term in the variance equation is reduced, meaning the portfolio's total volatility is strictly less than the weighted average of the individual assets' volatilities. This nonlinear reduction in risk is the absolute core of diversification.
2. Macroeconomic Mechanics: Dimensions of Diversification
Effective diversification requires spreading capital across multiple distinct dimensions. Simply owning 500 different technology stocks provides firm-level diversification but leaves the investor entirely exposed to sector and equity-market risk. True structural robustness requires diversification across the following tiers:
- Cross-Asset Class Diversification: Combining fundamentally different vehicles such as Equities (growth drivers, inflation hedges), Fixed Income (capital preservation, deflation hedges, income generation), Commodities (inflation shock absorbers), and Cash Equivalents (absolute liquidity).
- Geographic Diversification: Allocating across Domestic, Developed International (e.g., Eurozone, Japan), and Emerging Markets (e.g., India, Brazil). This hedges against localized recessions, regulatory changes, and most importantly, single-currency devaluation risk.
- Factor (Smart Beta) Diversification: Diversifying based on macroeconomic drivers of return. This includes allocating across Value vs. Growth, Small-Cap vs. Large-Cap, and High Momentum vs. Low Volatility equities. Each factor performs differently depending on the stage of the business cycle (expansion, peak, contraction, trough).
- Time Diversification (Dollar-Cost Averaging): Spreading the entry points of capital deployment over months or years. This mitigates the "sequence of returns risk" associated with investing a lump sum immediately before a severe market correction.
3. The Correlation Breakdown: Edge-Case Scenarios
While diversification is powerful, it is not infallible. The primary vulnerability of diversification strategies is "correlation breakdown" during systemic liquidity crises. During events like the 2008 Global Financial Crisis or the March 2020 pandemic crash, market panic causes a dash for cash. In these extreme edge cases, the correlation of almost all risk assets (equities, corporate bonds, real estate, commodities) converges to 1.0. Everything crashes simultaneously as leveraged participants face margin calls and liquidate any asset with a bid.
To survive correlation breakdown, a diversified portfolio must include "safe haven" assets—such as sovereign debt (U.S. Treasuries) or physical gold—which often experience an inverse surge in demand (negative correlation) during systemic panics, providing the critical ballast needed to offset extreme equity drawdowns.
4. Structured Comparison: Prominent Diversification Frameworks
Different institutional models approach the mathematics of diversification from unique philosophical standpoints. The table below outlines three dominant strategies utilized by wealth managers today.
| Diversification Strategy | Core Philosophy & Allocation | Pros / Cons |
|---|---|---|
| Traditional 60/40 Portfolio | Allocates strictly by capital: 60% broad equities for growth, 40% high-grade bonds for income/protection. | Pro: Simple, easy to implement and rebalance. Con: Highly vulnerable to stagflation; capital-weighted means 90% of the portfolio's risk actually comes from the equity portion. |
| The Endowment Model (Yale Model) | Heavy reliance on alternative, illiquid assets (Private Equity, Venture Capital, Timber, Real Estate) alongside public equities. | Pro: Captures the "illiquidity premium" for higher absolute returns. Con: Requires massive capital, locks up funds for years, extremely high fee structures. |
| Risk Parity (All Weather) | Allocates by risk contribution rather than capital. Uses leverage on safe assets (bonds) so they contribute equal volatility as stocks. | Pro: Theoretically perfectly balanced for any macroeconomic environment (inflation/deflation/growth). Con: Complex to manage, relies on leverage, suffers when both stocks and bonds decline simultaneously. |
5. Realistic Case Studies: Diversification in Action
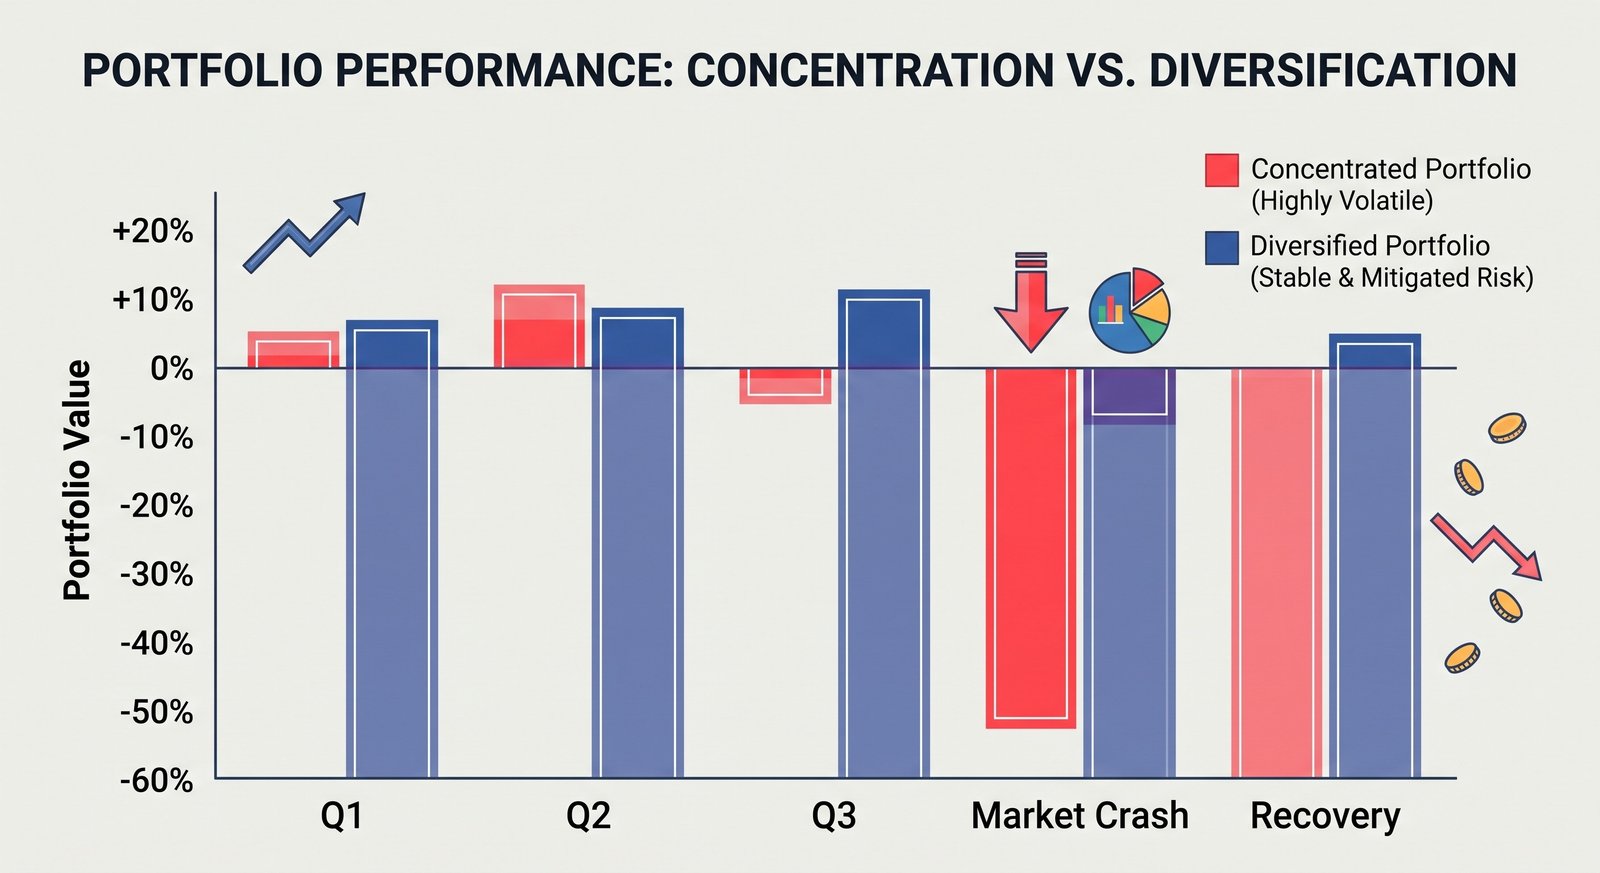
The theoretical mathematics of diversification become starkly apparent when applied to real-world wealth trajectories. Let us examine two contrasting investor scenarios to illustrate the protective power of asset non-correlation.
- Case Study 1: The Concentration Trap (Diworsification)
Profile: Elias, a 42-year-old software executive, accumulated a net worth of $2.5 million. Believing he was diversified, Elias held 40% of his wealth in his employer's restricted stock units (RSUs), 40% in a Nasdaq-100 ETF, and 20% in specific semiconductor stocks.
The Scenario: A severe regulatory crackdown on the tech sector coincides with rising interest rates. While Elias owns dozens of different companies, they share a correlation coefficient of nearly 0.95—they are all sensitive to the same macro factors. The tech sector contracts by 45%. Elias's portfolio plummets from $2.5M to $1.37M. Because his human capital (his salary) is also tied to the tech sector, he faces layoffs precisely when his financial capital is at its nadir. Elias confused holding many assets with holding uncorrelated assets. - Case Study 2: The Multi-Asset Buffer
Profile: Sophia, a 55-year-old architect, manages a $1.8 million portfolio. She utilizes a structural risk-parity approach: 40% Global Equities (split between US and Emerging Markets), 30% Sovereign Treasuries, 15% Real Estate Investment Trusts (REITs), and 15% Physical Gold.
The Scenario: The global economy enters a period of stagflation (high inflation, stagnant growth). Her US equities suffer a 20% drawdown, and her bonds lose 10% due to rising rates. However, her Emerging Market equities, heavily tied to commodity exports, rally by 15%. Her physical gold, reacting to inflation fears and currency debasement, surges by 30%, and her REITs increase by 10% as rents are adjusted for inflation. By the end of the year, despite a brutal US stock market, Sophia's overall portfolio is down less than 2%, preserving her wealth and providing psychological stability to prevent panic selling.
6. Actionable Strategy Guide: Step-by-Step Implementation
Transitioning from conceptual theory to a robust, diversified portfolio requires a systematic approach. Follow this guide to structurally immunize your wealth.
- Step 1: Define Asset Class Silos. Begin by dividing your capital into broad, mutually exclusive categories. A standard starting framework is Equities (for growth), Fixed Income (for capital preservation), and Alternatives (for inflation protection/non-correlation).
- Step 2: Implement Geographic Spread. Within your equity silo, do not succumb to "home country bias." Ensure your investments are distributed across your domestic market, Developed International markets, and Emerging Markets. A common ratio is 60% domestic / 40% international equities.
- Step 3: Utilize Low-Cost Index Funds and ETFs. To eliminate idiosyncratic company risk, avoid picking individual stocks. Use broad-market Exchange-Traded Funds (ETFs) to capture the beta (market return) of an entire sector, country, or asset class at a fraction of the cost of active management.
- Step 4: Audit for Factor Overlap. Use portfolio analysis tools to look "under the hood" of your ETFs. If you own a Large-Cap ETF, a Tech-Sector ETF, and an S&P 500 ETF, you are heavily over-weighted in the exact same mega-cap tech stocks. Ensure your holdings are genuinely capturing different risk premiums.
- Step 5: Establish a Rebalancing Protocol. Over time, outperforming assets will skew your intended diversification (e.g., a stock bull market turns a 60/40 portfolio into an 80/20 portfolio). Implement a mechanical rule to rebalance annually, or whenever an asset class drifts more than 5% from its target weight. This forces you to buy low and sell high.
Frequently Asked Questions
Q: Is it possible to over-diversify a portfolio?
Yes, this is known as "diworsification." While adding the first 20 to 30 randomly selected stocks to a single-stock portfolio drastically reduces idiosyncratic risk, mathematical models show that adding stocks beyond 50 provides rapidly diminishing marginal benefits. If an investor buys too many actively managed funds with overlapping holdings, they effectively create an expensive, complex index fund that will inevitably underperform the benchmark due to excessive fee drag.
Q: Does diversification guarantee that I will not lose money?
No. Diversification is a risk management tool, not a loss-prevention guarantee. It is designed to virtually eliminate unsystematic risk (the risk of a single company going bankrupt), but it cannot eliminate systematic risk (the inherent risk of participating in the global economy). In a severe global recession, a diversified portfolio will still lose value, but the mathematical goal is for it to lose substantially less—and recover substantially faster—than a concentrated portfolio.
Q: Why should I hold bonds or gold if stocks historically have higher long-term returns?
While equities generally dominate in absolute long-term return, the path to those returns is extremely volatile. Most investors lack the psychological fortitude (risk tolerance) or the financial liquidity (risk capacity) to endure a 50% drawdown in a 100% equity portfolio without panic selling. Bonds, gold, and other non-correlated assets act as structural shock absorbers. They smooth the volatility curve, allowing the investor to remain invested and successfully capture the long-term equity premium.
Q: How does time diversification (Dollar-Cost Averaging) actually reduce risk?
Time diversification mitigates the specific risk of misjudging market peaks. By deploying a set amount of capital at regular intervals (e.g., buying $1,000 of an ETF every month), you mathematically purchase more shares when prices are low and fewer shares when prices are high. Over volatile periods, this lowers the average cost basis per share and insulates the investor from the devastating sequence-of-returns risk that occurs if a single lump-sum investment is made immediately prior to a market crash.
See also
- Loading related topics...