Dividend Investing Strategy
1. Introduction to the Dividend Philosophy
Dividend investing is one of the oldest, most reliable, and deeply scrutinized methodologies in the history of capital markets. At its essence, a dividend investing strategy involves deliberately allocating capital to companies that possess a track record of returning a portion of their earnings directly to shareholders in the form of cash payments. Unlike pure growth investing, which relies entirely on capital appreciation (the stock price going up) to generate returns, dividend investing provides a dual-engine for wealth creation: capital appreciation combined with a predictable, recurring cash flow stream.
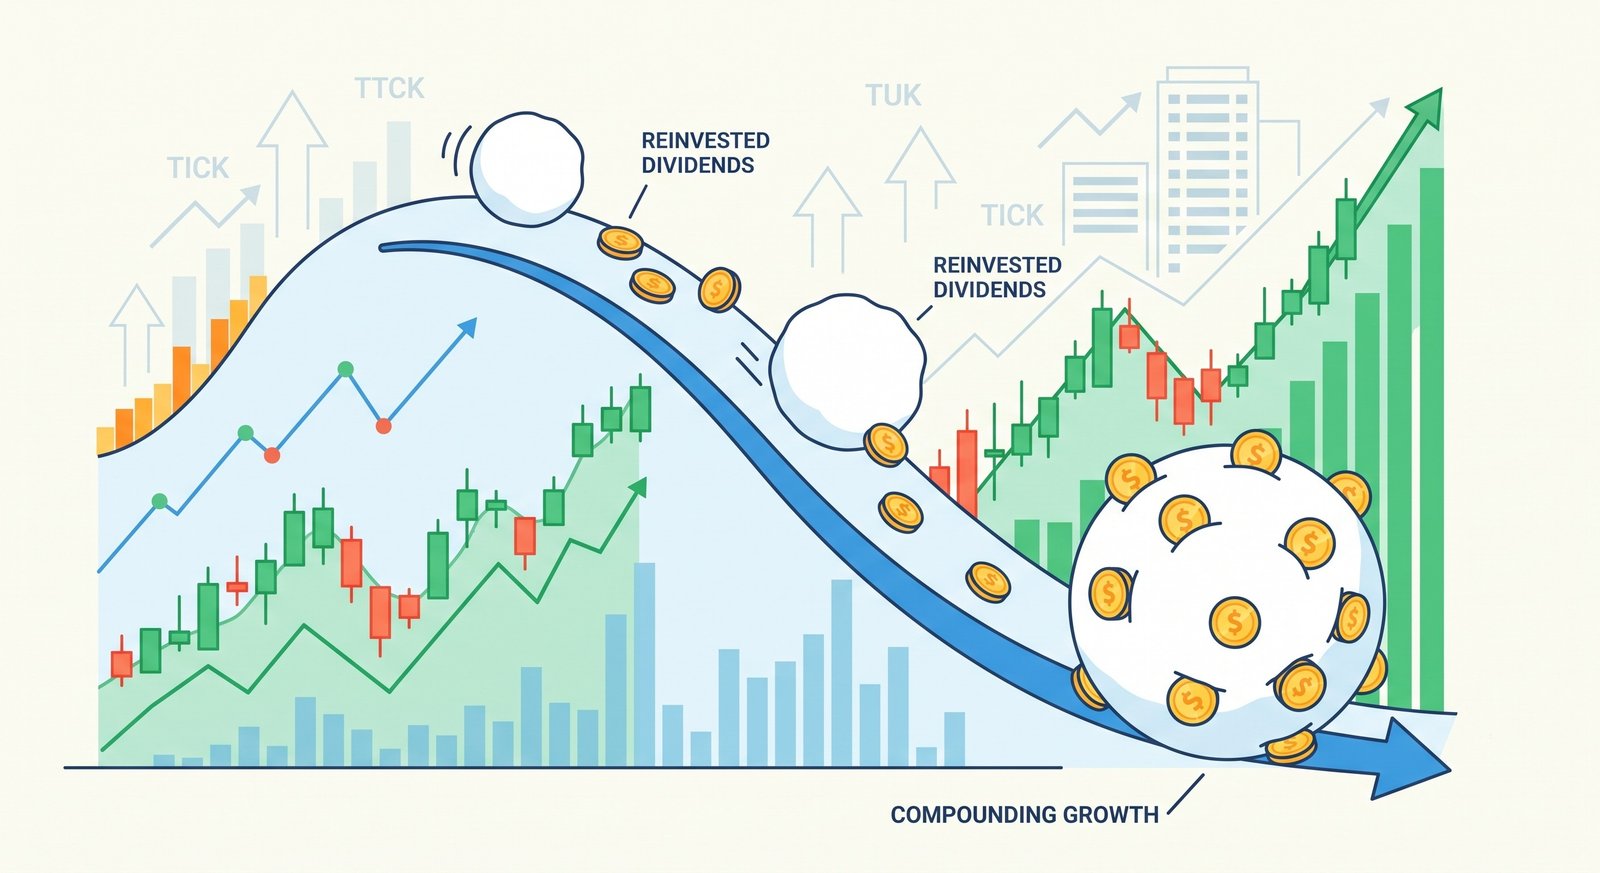
The psychological and mathematical advantages of this strategy are profound. In volatile, sideways, or bear markets, growth investors may watch their portfolios stagnate or decline for years without realizing any tangible return. The dividend investor, however, continues to receive cash payouts regardless of the daily whims of Mr. Market. When these cash payouts are systematically reinvested into purchasing more shares of the dividend-paying stock, it triggers a powerful phenomenon known as the "dividend snowball." Over decades, this compounding mechanism drastically reduces portfolio volatility and has historically been responsible for a significant percentage of the S&P 500's total annualized return.
2. Deep-Dive Explanations & Formulas: The Metrics of Income
To successfully execute a dividend investing strategy, an investor must move beyond simply chasing high yields. The true artistry of this approach lies in risk mitigation—ensuring that the underlying cash flow is sustainable and growing. This requires a rigorous application of fundamental formulas.
- Dividend Yield: This is the most basic metric, representing the annual dividend payment as a percentage of the stock's current price. It essentially measures the return on investment strictly from cash flow, assuming the stock price remains constant.
Formula: Dividend Yield = (Annual Dividends Per Share / Current Stock Price) × 100 - Dividend Payout Ratio (DPR): The DPR is arguably the most critical metric for assessing dividend safety. It reveals what percentage of a company's net income is being distributed as dividends. A ratio that is too high (typically over 75% for standard corporations) indicates the dividend may be unsustainable if earnings drop.
Formula: Payout Ratio = (Annual Dividends Per Share / Earnings Per Share) - Free Cash Flow (FCF) Payout Ratio: Because Net Income includes non-cash items like depreciation and amortization, seasoned analysts prefer to measure dividend safety against Free Cash Flow. Cash, not accounting profits, pays dividends.
Formula: FCF Payout Ratio = (Total Dividends Paid / Free Cash Flow) - Dividend Compound Annual Growth Rate (CAGR): This measures the annualized rate at which a company has increased its dividend payout over a specific timeframe (e.g., 5 or 10 years). Companies that consistently grow their dividend outpace inflation and exponentially increase the investor's return over time.
Formula: CAGR = [(Ending Dividend Value / Beginning Dividend Value)^(1 / Number of Years)] - 1 - Yield on Cost (YOC): A metric tracking the dividend yield based on the investor's original purchase price, rather than the current market price. As a company raises its dividend, an investor's YOC increases, vividly illustrating the power of buying and holding dividend growth stocks.
Formula: YOC = (Current Annual Dividend Per Share / Average Purchase Price Per Share)
3. Macroeconomic Mechanics: Interest Rates and Inflation
A robust dividend strategy does not operate in a vacuum; it is highly sensitive to macroeconomic shifts, particularly Central Bank interest rate policies and inflation data. Dividend stocks are often viewed as "bond proxies" by institutional capital. When a central bank (like the Federal Reserve) cuts interest rates to near zero, the yield on virtually risk-free government treasury bonds plummets. In search of yield, capital floods out of the bond market and into high-quality dividend-paying stocks, driving their share prices up and their yields down.
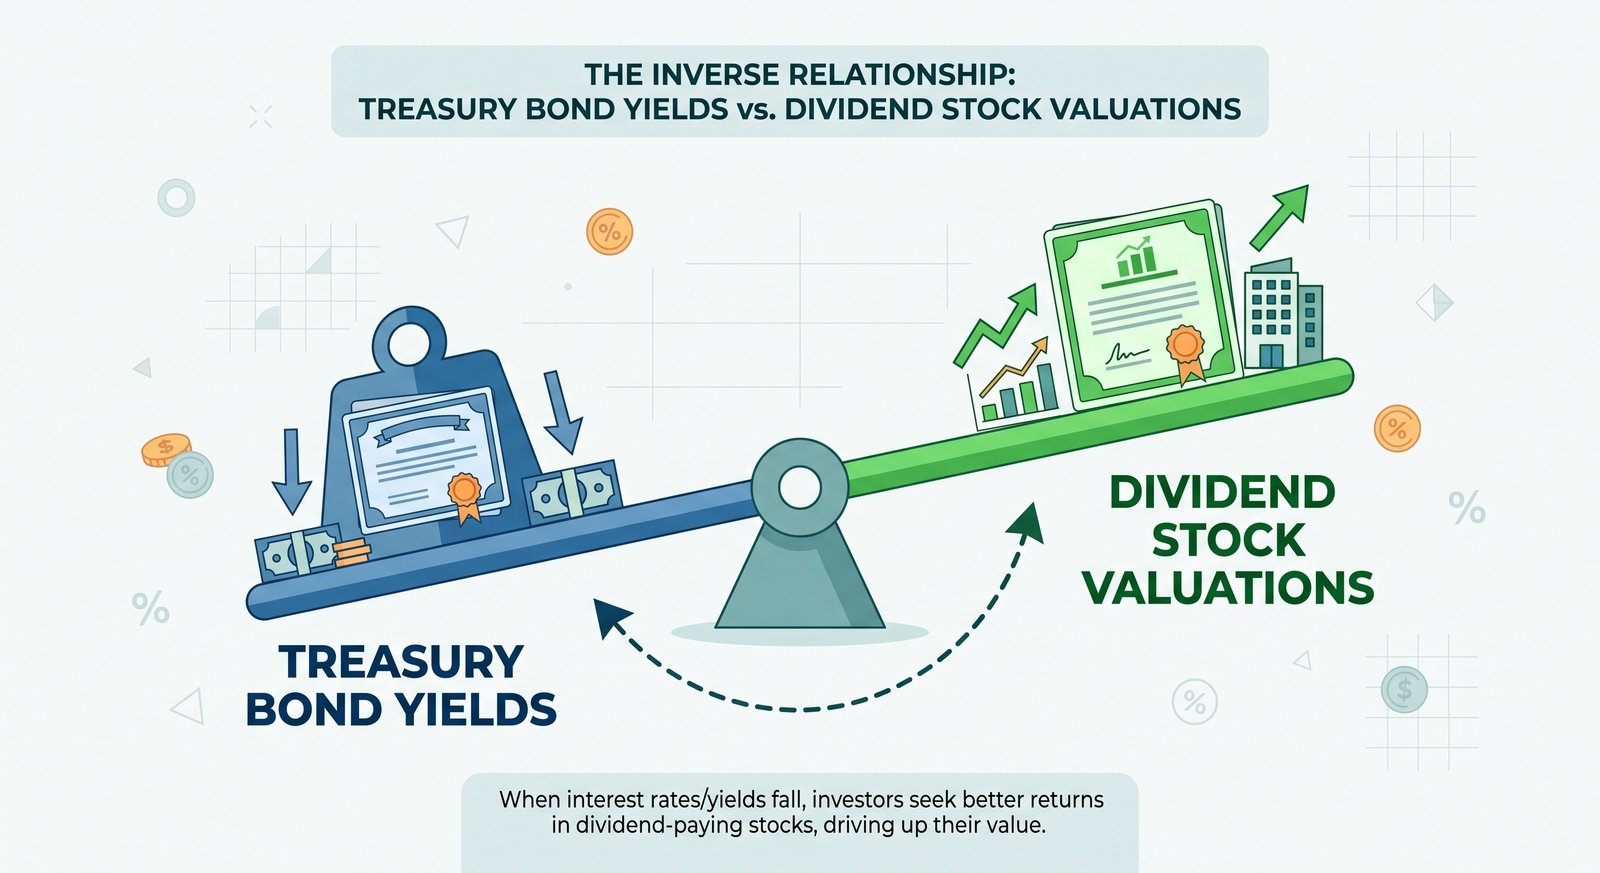
Conversely, in a tightening macroeconomic environment characterized by soaring inflation and aggressive interest rate hikes, dividend stocks face severe headwinds. If a risk-free 10-year Treasury bond yields 5.5%, a utility stock yielding 4% suddenly looks highly unattractive, as investors are taking on equity risk for a lower return. Consequently, the utility stock's price will fall until its yield reaches equilibrium with the risk-free rate plus an equity risk premium. Understanding this macroeconomic seesaw is critical for avoiding buying dividend stocks at cyclical peaks.
However, this is where the sub-strategy of Dividend Growth Investing (DGI) shines. While high-yield, slow-growth stocks act like fixed-income bonds and suffer during inflation, companies with low initial yields but aggressive double-digit dividend growth rates serve as profound inflation hedges. As the cost of living increases, these companies pass costs onto consumers, boost earnings, and hike their dividends—preserving the investor's purchasing power.
4. Edge Cases: REITs, MLPs, and the Nuances of Accounting
When executing a dividend strategy, investors inevitably encounter high-yielding alternative asset classes like Real Estate Investment Trusts (REITs) and Master Limited Partnerships (MLPs). Applying standard corporate accounting formulas to these entities will result in disastrous miscalculations.
For example, REITs are legally required to distribute at least 90% of their taxable income to shareholders. Because real estate involves massive non-cash depreciation charges, standard Net Income is artificially suppressed. If an analyst looks at a REIT's Earnings Per Share (EPS) to calculate the Payout Ratio, it will often appear well over 100%, falsely triggering a "dividend cut warning." Instead, for REITs, one must calculate safety using Funds From Operations (FFO) or Adjusted Funds From Operations (AFFO), which add back depreciation. Similarly, MLPs distribute capital based on Distributable Cash Flow (DCF). Navigating these edge cases requires specialized knowledge of sector-specific accounting structures.
5. Case Study 1: The Dividend Yield Trap (A Value Destruction Scenario)
Novice dividend investors frequently fall victim to the "Yield Trap." A yield trap occurs when a company's dividend yield becomes artificially inflated strictly because its stock price is collapsing due to fundamental deterioration. Let us examine the fictional case of CenturyComm Telecommunications.
Marcus, a retired investor seeking high current income, screens the market and finds CenturyComm offering a staggering 14% dividend yield. The stock trades at $20 a share, paying a $2.80 annual dividend. Intoxicated by the yield, Marcus buys 5,000 shares ($100,000 total investment), expecting $14,000 in annual passive income. However, he fails to look under the hood.
CenturyComm's traditional wireline business is dying. Their free cash flow has dropped by 40% over two years, and their FCF Payout Ratio is now 160%—meaning they are borrowing money at 8% interest just to pay the dividend. Six months after Marcus buys the stock, management is forced to cut the dividend by 80% to service their mounting debt. The market panics, and the stock price plummets from $20 to $6. Marcus's portfolio is crushed: his $100,000 principal is now worth $30,000, and his expected $14,000 income drops to a meager $2,800. This perfectly illustrates why a high yield must always be cross-referenced with payout ratios and cash flow trajectories.
6. Case Study 2: Yield on Cost and the Power of Dividend Growth
Contrast Marcus's disaster with Eleanor's strategy. Eleanor is 40 years old and focuses entirely on Dividend Growth Investing (DGI). She ignores high yields and focuses on companies with impregnable balance sheets and a history of annual dividend hikes. She purchases 1,000 shares of OmniConsumer Products (OCP) at $50 per share ($50,000 total).
At the time of purchase, OCP pays an annual dividend of $1.50 per share, giving it a seemingly unexciting starting yield of 3.0%. However, OCP dominates its industry and boasts a Free Cash Flow Payout Ratio of just 40%. Because of this massive margin of safety and consistent earnings growth, OCP's management increases the dividend by 9% every single year.
Fast forward 15 years. Through the magic of compound annual growth, OCP's dividend has grown from $1.50 to $5.46 per share. The stock price has also appreciated to $180 to maintain an average 3% market yield. Eleanor is now receiving $5,460 in annual dividends on her original $50,000 investment. Her Yield on Cost (YOC) is now an incredible 10.9% ($5.46 / $50.00). Furthermore, her principal has grown to $180,000. By prioritizing growth and safety over immediate high yield, Eleanor secured a rapidly expanding income stream that vastly outpaced inflation, without ever having to sell a single share.
7. Structured Comparison: High Yield vs. Dividend Growth vs. Indexing
Not all dividend strategies are created equal. Depending on an investor's time horizon, risk tolerance, and immediate income needs, they must choose a specific lane. The following table contrasts the three primary methodologies of generating returns in the stock market.
| Strategy Focus | Dividend Growth Investing (DGI) | High Current Yield (Income Focus) |
|---|---|---|
| Target Demographic | Young to Middle-aged investors building long-term wealth. | Retirees needing immediate cash flow to pay living expenses. |
| Typical Initial Yield | 1.5% to 3.5% | 5.0% to 9.0%+ |
| Dividend CAGR (Growth) | High (7% to 15% annually) | Low to Stagnant (0% to 3% annually) |
| Typical Sectors | Technology, Consumer Staples, Healthcare, Financials. | Utilities, REITs, Telecom, Master Limited Partnerships (MLPs). |
| Primary Risk Factor | Overpaying for future growth that fails to materialize. | The Dividend Trap (unsustainable payouts leading to severe cuts). |
8. Actionable Strategy Guide: Executing a Dividend Portfolio
Knowledge without execution is meaningless. To build an optimized, resilient dividend portfolio, follow this step-by-step institutional-grade framework to filter out noise and focus on quality cash flows.
- Step 1: Establish the "Chowder Rule" Threshold. Developed by a famous retail investor, the Chowder Rule combines Current Yield + 5-Year Dividend Growth Rate. For most equities, aim for a Chowder Score of 12 or higher (e.g., a 3% yield + 9% annual growth = 12). For utilities or high-yield sectors, accept an 8 (e.g., 5% yield + 3% growth = 8). This quickly screens for total return viability.
- Step 2: Screen for Payout Safety. Discard any traditional C-Corporation that pays out more than 65-70% of its Earnings Per Share or Free Cash Flow as dividends. Exceptions exist only for REITs and MLPs, but for standard stocks, a high payout ratio means management has no retained earnings to reinvest in R&D or endure a recession.
- Step 3: Verify the Dividend Growth Streak. Look at the historical track record. Has the company raised its dividend for 10+ consecutive years (Dividend Contenders), 25+ years (Dividend Aristocrats), or 50+ years (Dividend Kings)? A company that raised its dividend through the 2008 Financial Crisis and the 2020 Pandemic has a highly stress-tested business model.
- Step 4: Diversify Across Defensive and Cyclical Sectors. Do not yield chase into a single sector. A portfolio of 100% REITs and Utilities will suffer massively in a rising interest rate environment. Blend defensive staples (like Johnson & Johnson or Procter & Gamble) with cyclical growth payers (like Broadcom or Texas Instruments) to smooth out macroeconomic shocks.
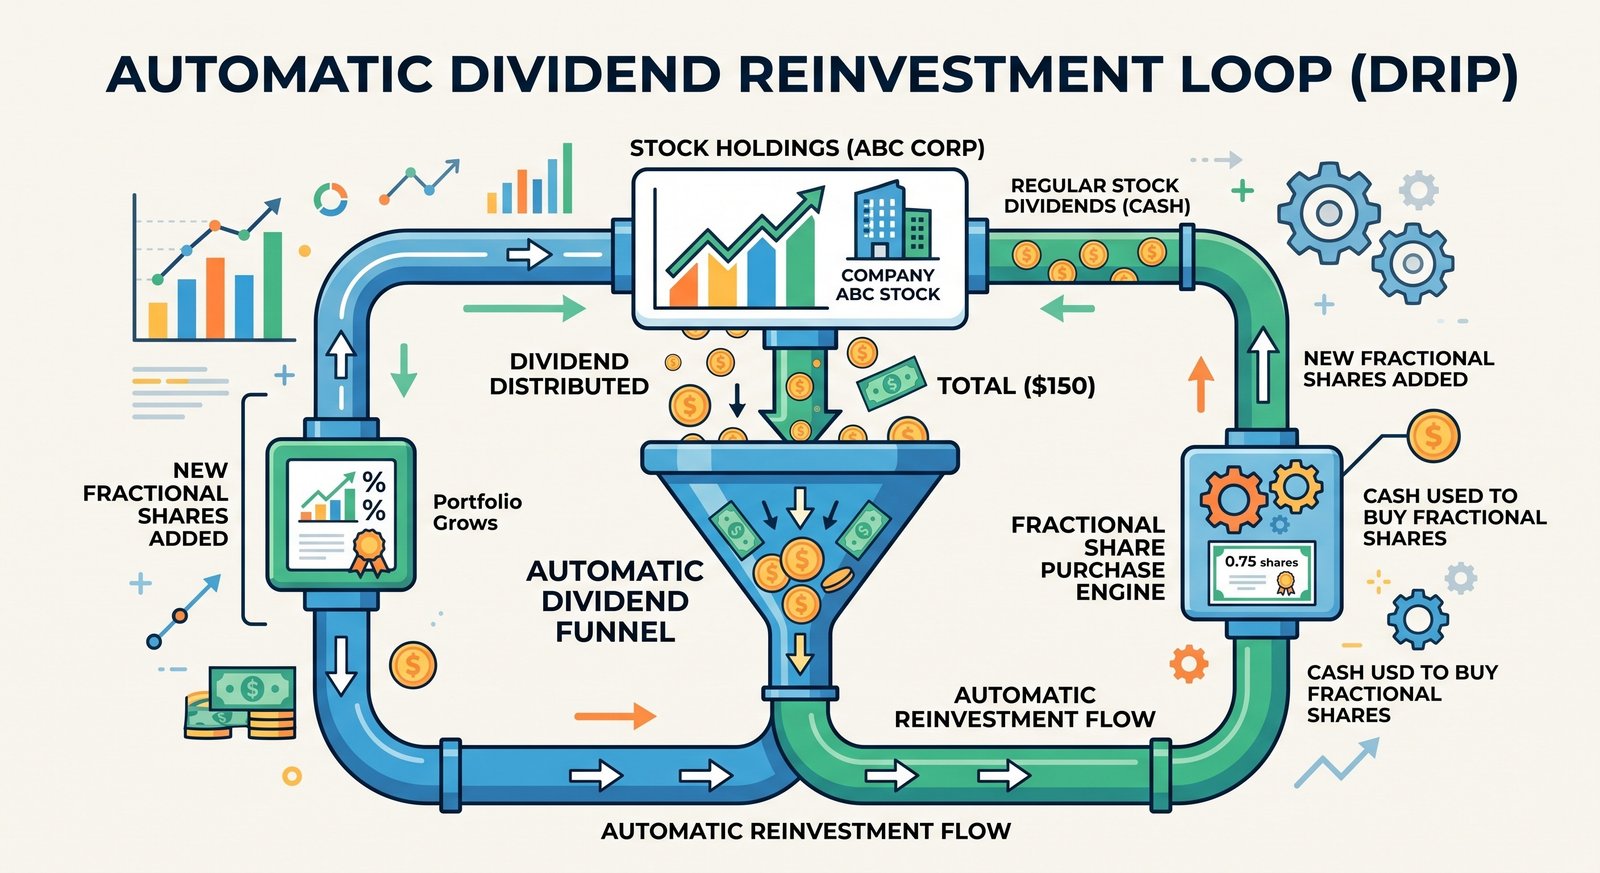
- Step 5: Automate Reinvestment via DRIP. Log into your brokerage and activate the Dividend Reinvestment Plan (DRIP). This automatically takes the cash received and buys fractional shares of the stock, at no commission, on the exact day it is paid. This leverages dollar-cost averaging and puts the compound interest snowball on autopilot.
9. Frequently Asked Questions (FAQs)
Q: What is the difference between the Ex-Dividend Date and the Record Date?
The Record Date is the date set by the company's board of directors by which an investor must be on the company's books to receive a dividend. However, because stock trades take T+1 days to settle, the exchanges set an "Ex-Dividend Date" one business day before the Record Date. You MUST purchase the stock before the ex-dividend date to receive the upcoming payment. If you buy on or after the ex-dividend date, the previous owner gets the dividend.
Q: How are dividends taxed? Do they drag on portfolio performance?
Taxation is a major consideration. In standard brokerage accounts, "Qualified Dividends" (paid by U.S. corporations held for more than 60 days) are taxed at favorable long-term capital gains rates (0%, 15%, or 20% depending on income). "Ordinary Dividends" (like those from REITs or bonds) are taxed at your standard marginal income tax rate, which is much higher. To avoid tax drag, many investors hold high-yielding ordinary dividend payers in tax-advantaged accounts like IRAs or Roth IRAs, where they can compound tax-free.
Q: Can a company cut or completely suspend its dividend?
Absolutely. Unlike bond interest payments, which are legal contractual obligations, dividends are entirely discretionary. The Board of Directors can vote to cut, suspend, or cancel the dividend at any time if the company faces financial distress or needs capital for a major acquisition. This is why payout ratios and free cash flow analysis are infinitely more important than the current dividend yield.
Q: Why don't all profitable, successful companies pay dividends?
Many ultra-successful tech and growth companies (like Amazon, Alphabet, or historically Berkshire Hathaway) do not pay dividends. Their management teams believe that retaining 100% of the profits and reinvesting them back into the business (through R&D, acquisitions, or share buybacks) will generate a much higher return on equity than handing the cash back to shareholders. Once a company matures and runs out of aggressive growth avenues, it transitions to returning capital via dividends.
See also
- Loading related topics...