Dollar-Cost Averaging
The Strategic Architecture of Systematic Wealth Accumulation
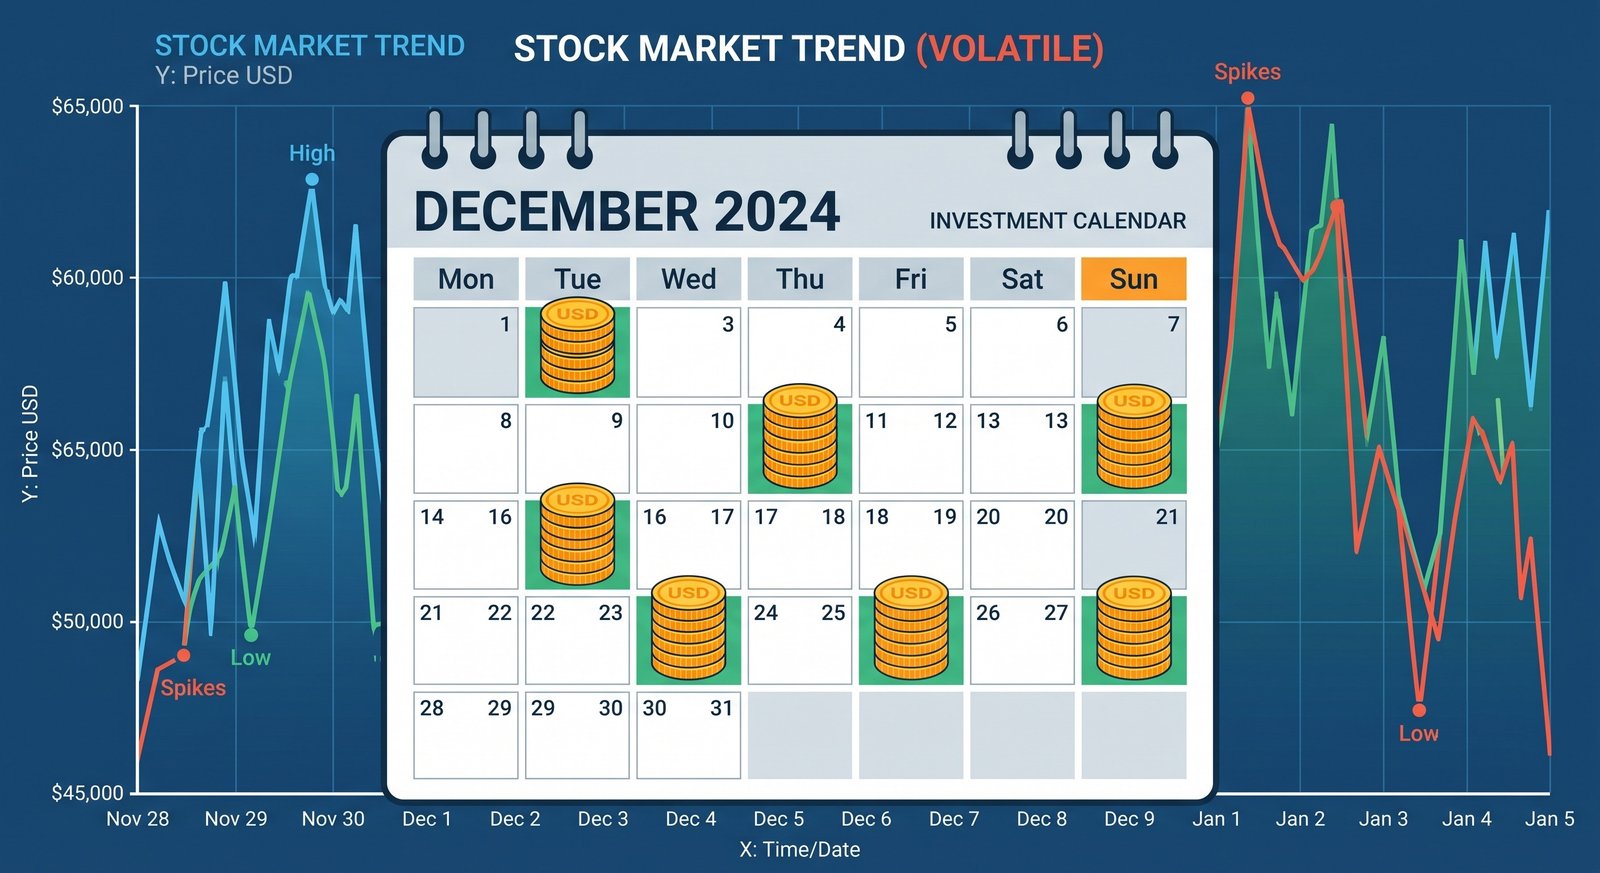
Dollar-Cost Averaging (DCA)—frequently referred to in global contexts as a Systematic Investment Plan (SIP) or constant dollar plan—is a foundational investment strategy wherein an investor allocates a fixed, predetermined amount of capital into a specific asset or portfolio at regular intervals, regardless of the asset's current price or prevailing macroeconomic conditions. By divorcing the act of investing from the emotional turmoil of market volatility, DCA effectively neutralizes one of the most destructive behavioral biases in finance: the attempt to time the market.
The underlying mechanics of DCA are remarkably elegant. Because the dollar amount invested remains constant, the investor mathematically purchases a greater number of shares when the asset's price is depressed and a fewer number of shares when the asset's price is elevated. Over an extended time horizon, this systemic accumulation inherently lowers the average cost basis per share relative to the average market price of the asset during that same period. While DCA does not guarantee a profit or entirely insulate an investor from systemic risk, it serves as the ultimate psychological and mathematical safeguard against deploying all available capital at the exact peak of a market bubble.
1. Theoretical Foundations: Behavioral Finance and Timing Risk
To appreciate the necessity of Dollar-Cost Averaging, one must first understand the structural flaws of human psychology when exposed to financial markets. Behavioral finance dictates that human beings are highly susceptible to Loss Aversion and Recency Bias. When markets are rapidly crashing, fear paralyzes the investor, preventing them from deploying capital when assets are fundamentally cheap. Conversely, during euphoric bull markets, "Fear of Missing Out" (FOMO) compels investors to deploy massive amounts of capital at peak valuations. This dynamic results in the average retail investor severely underperforming the very funds they invest in, a phenomenon documented annually by DALBAR's Quantitative Analysis of Investor Behavior (QAIB).
DCA solves this by introducing total automation. It transitions the investor from an active, emotional decision-maker to a passive, systematic accumulator. Furthermore, it directly addresses Timing Risk. If an investor inherits a large sum of money and invests it all on a single day (Lump Sum Investing), their entire financial trajectory is tethered to the valuation of the market on that specific date. If they happen to invest on the eve of a global recession, their portfolio may suffer a drawdown that takes a decade to recover. DCA mitigates this sequence of returns risk by spreading the entry points across various phases of the economic cycle.
2. Deep-Dive Explanations & Formulas: The Mathematics of DCA
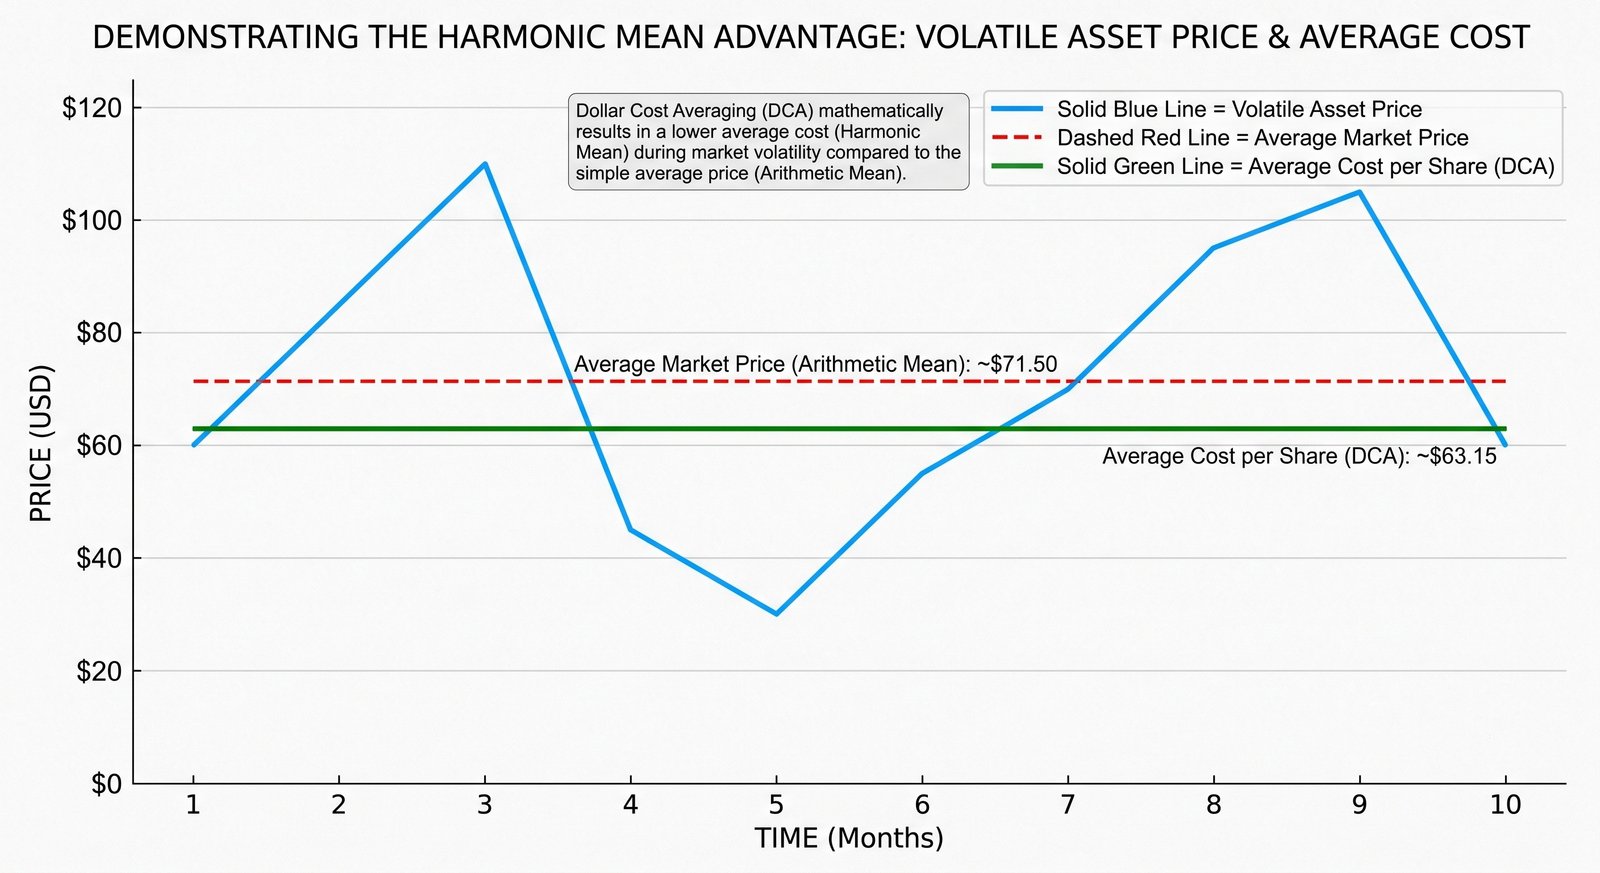
The primary mathematical advantage of DCA is often misunderstood. It is not merely that you are "buying the dips"; it is the mathematical certainty that your Average Cost per Share will always be lower than the Average Market Price during periods of volatility. This is driven by the properties of the Harmonic Mean.
Let us define the variables. An investor commits a fixed investment amount $I$ at regular intervals. Over $n$ periods, the asset prices are $P_1, P_2, ..., P_n$.
The number of shares purchased in period $i$ is calculated as:
$$S_i = \frac{I}{P_i}$$
The Average Market Price ($P_{avg}$) over the entire timeframe is simply the arithmetic mean of the prices:
$$P_{avg} = \frac{\sum_{i=1}^{n} P_i}{n}$$
However, the investor's actual Average Cost per Share ($C_{avg}$) is the total capital invested divided by the total shares accumulated. This translates to the harmonic mean of the purchase prices:
$$C_{avg} = \frac{n \cdot I}{\sum_{i=1}^{n} S_i} = \frac{n}{\sum_{i=1}^{n} \frac{1}{P_i}}$$
In mathematics, Cauchy's inequality proves that the harmonic mean of a set of positive, non-identical numbers is always strictly less than their arithmetic mean. Therefore, as long as the asset's price fluctuates, $C_{avg} < P_{avg}$. This mathematical truth ensures that the DCA investor is systemically weighted toward efficiency, automatically exploiting volatility without requiring predictive foresight.
3. Macroeconomic Mechanics: DCA Across Market Regimes
The efficacy of Dollar-Cost Averaging varies significantly depending on the broader macroeconomic environment and the secular trend of the specific asset class.
- The Bear Market (Contraction): This is where DCA fundamentally shines. As central banks tighten monetary policy and asset valuations contract, a lump-sum investor suffers immediate and severe wealth destruction. The DCA investor, however, continues to deploy their fixed monthly capital. As prices drop lower and lower, their fixed capital buys exponentially more shares. When the market eventually cycles back into an expansionary phase, the sheer volume of shares accumulated at the absolute bottom accelerates the portfolio's compounding rate dramatically.
- The Bull Market (Expansion): During a protracted, uninterrupted secular bull market, DCA mathematically underperforms a Lump Sum Investment. Because prices are constantly rising, the DCA investor is buying fewer shares at increasingly higher valuations, leaving a portion of their capital sitting in low-yielding cash while they wait for the next installment date. In a pure, uninterrupted upward trajectory, deploying all capital on Day 1 is mathematically optimal.
- The Sideways (Range-Bound) Market: In a market characterized by high volatility but zero net growth over a decade, a lump sum investment yields exactly 0% return. However, due to the harmonic mean advantage discussed earlier, a DCA investor actively interacting with that same flat market will actually generate a positive return, as they consistently lowered their cost basis during the intra-decade dips.
4. Structured Comparison: DCA vs. Lump Sum Investing (LSI)
The debate between DCA and LSI is highly nuanced, hinging on the origin of the capital (cash flow vs. windfall) and the investor's specific risk tolerance.
| Metric / Factor | Dollar-Cost Averaging (DCA) | Lump Sum Investing (LSI) |
|---|---|---|
| Historical Outperformance | Outperforms ~33% of the time (specifically when markets crash shortly after investing begins). | Outperforms ~67% of the time, as markets generally trend upward over long horizons. |
| Psychological Comfort | Extremely High. Minimizes regret risk if the market drops immediately. | Low. High anxiety regarding immediate market pullbacks destroying initial capital. |
| Cash Drag | High. Uninvested capital waiting to be deployed loses purchasing power to inflation. | None. All capital is immediately put to work compounding. |
| Ideal Source of Capital | Future cash flows (e.g., monthly salary). | Existing liquid windfalls (e.g., inheritance, bonus, property sale). |
5. Realistic Case Studies: DCA in Action
To fully grasp the mechanics, let us examine two practical scenarios that demonstrate how DCA manipulates cost basis and interacts with investor psychology.
- Case Study 1: The Volatility Harvester (Consistent Salary Flow)
Profile: Rajesh is a 35-year-old IT professional who commits to investing ₹20,000 every month into a broad-market equity index fund. He begins his journey just as the economy enters a turbulent recession.
Scenario in Action: Over five months, the index fund's Net Asset Value (NAV) behaves erratically: Month 1 (₹100), Month 2 (₹50), Month 3 (₹40), Month 4 (₹50), Month 5 (₹80).
Rajesh's fixed ₹20,000 buys varying shares: 200 shares, 400 shares, 500 shares, 400 shares, and 250 shares, respectively. Total invested: ₹100,000. Total shares acquired: 1,750.
The Mathematical Result: The average market price over these five months was ₹64. However, Rajesh's actual average cost per share is only ₹57.14 (₹100,000 / 1,750). Even though the market at Month 5 (₹80) is still 20% lower than where it started (₹100), Rajesh’s portfolio is already sitting on a massive profit. His 1,750 shares are now worth ₹140,000. DCA turned a bear market into an aggressive wealth-generating machine. - Case Study 2: The Windfall Dilemma (Regret Minimization)
Profile: Sunita unexpectedly receives a ₹1,200,000 lump sum from the sale of an ancestral property. Mathematically, she knows that deploying it all at once into an equity mutual fund gives her the highest probability of maximum long-term returns. However, the market is currently at all-time highs, and her risk tolerance is fragile.
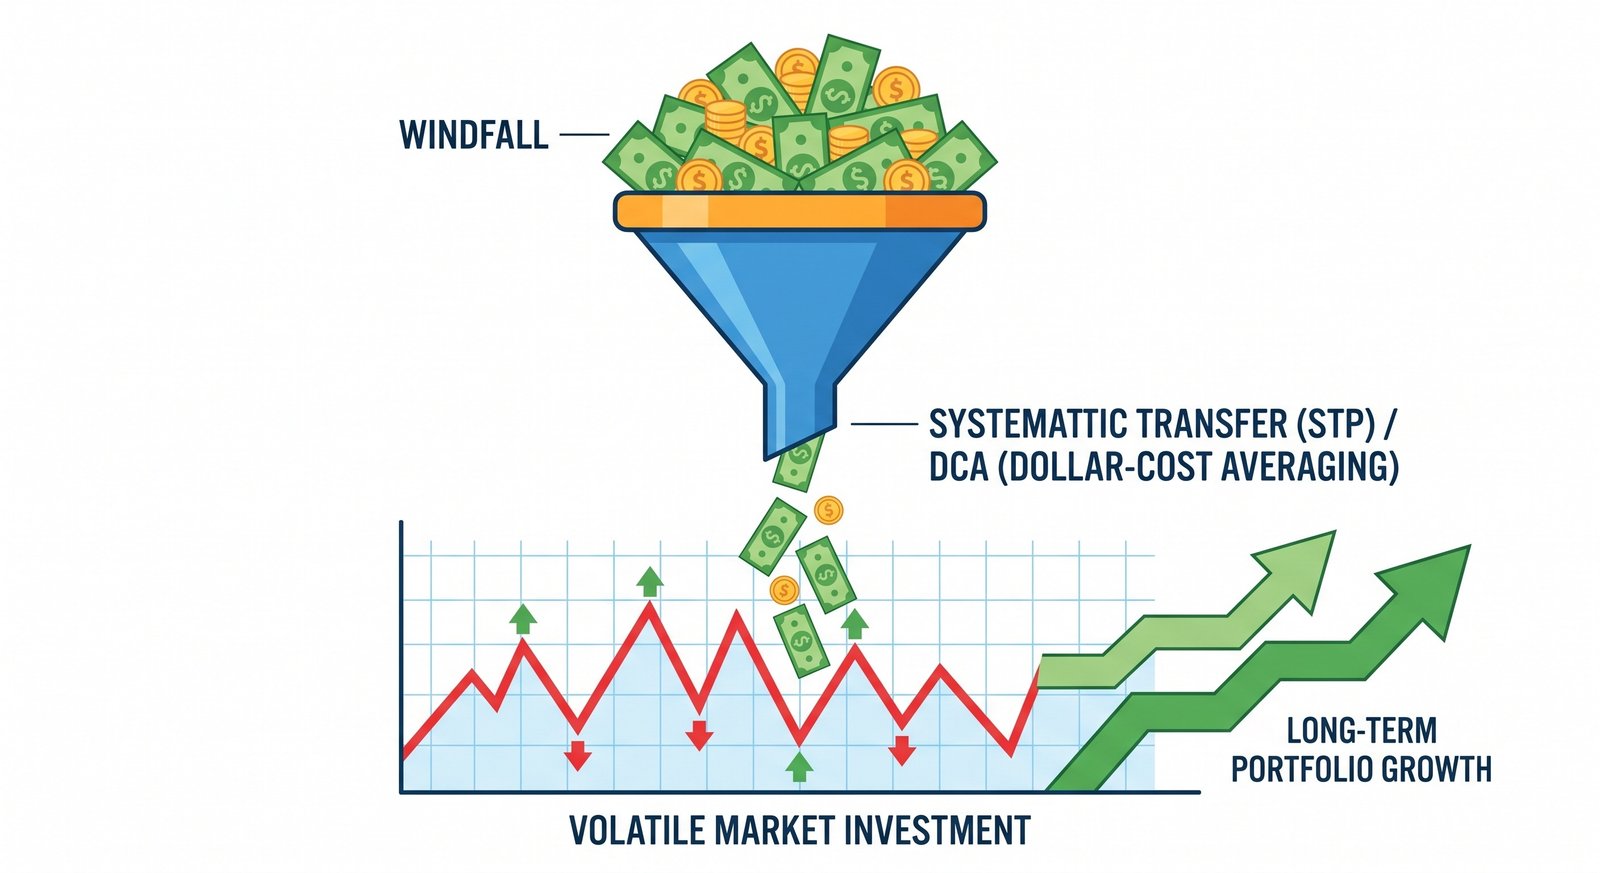
Scenario in Action: Instead of risking a behavioral panic-sell if a correction occurs the day after she invests, she utilizes DCA as a psychological bridge. She parks the ₹1,200,000 in a safe Liquid Mutual Fund yielding 6% annually. She then sets up a Systematic Transfer Plan (STP) to automatically move ₹100,000 on the 1st of every month from the liquid fund into a high-growth equity fund over the next 12 months. This hybrid approach mitigates "cash drag" (by earning a yield on the uninvested portion) while providing the psychological armor of DCA, ensuring that if the market crashes in month 4, she is actively buying the dip with the remaining capital.
6. Advanced Iterations: Value Averaging and Enhanced DCA
For sophisticated investors, traditional DCA can be optimized to capture even greater excess returns (alpha) by moving from a static allocation to a dynamic, formulaic allocation.
Value Averaging (VA): Unlike DCA, which focuses on fixed *contributions*, VA focuses on a fixed portfolio *growth target*. For example, an investor wants their portfolio value to increase by ₹10,000 every month. In Month 1, they invest ₹10,000. If the market crashes in Month 2 and the portfolio value drops to ₹8,000, the investor must inject ₹12,000 to reach the ₹20,000 total target for Month 2. Conversely, if the market explodes upward and the initial ₹10,000 grows to ₹15,000, the investor only needs to inject ₹5,000 in Month 2. VA forces an investor to buy aggressively during crashes and pull back drastically during bubbles, often mathematically outperforming standard DCA, though it requires complex tracking and access to variable cash reserves.
Enhanced Dollar-Cost Averaging (EDCA): This strategy utilizes technical indicators to modify the standard DCA amount. An investor establishes a baseline contribution (e.g., ₹5,000/month). However, they apply a modifier based on a moving average or the Relative Strength Index (RSI). If the asset price drops 15% below its 200-day moving average (signaling oversold conditions), the EDCA rules dictate doubling the contribution to ₹10,000. While effective, it borders on market-timing and reintroduces the risk of human emotion if the rules are not strictly algorithmic.
7. Actionable Strategy Guide: Step-by-Step Implementation
Executing a DCA strategy correctly requires discipline and infrastructure. Follow this precise blueprint to automate your wealth creation.
- Step 1: Quantify the Free Cash Flow. Analyze your monthly net income and rigorously subtract fixed expenses, debt obligations, and emergency fund contributions. The remaining figure is your maximum DCA capacity. It is critical to select a number you can sustain even during a personal financial squeeze, as stopping a DCA plan during a recession destroys its mathematical advantage.
- Step 2: Select High-Volatility, Upward-Trending Assets. DCA works best on assets that fluctuate wildly but have a long-term macroeconomic tailwind. Broad-market equity index funds (S&P 500, Nifty 50) are the optimal vehicles. Using DCA on a highly stable, non-volatile asset (like a bond fund) yields negligible benefits because there are no deep dips to exploit.
- Step 3: Establish Strict Automation. Do not rely on manual transfers. The entire premise of DCA is removing the psychological burden of action. Configure an automated clearing house (ACH) mandate or auto-debit with your brokerage to pull the funds on the exact day your salary clears (e.g., the 1st of every month). Out of sight, out of mind.
- Step 4: Ignore the Noise. Once the system is active, uninstall financial news applications. The success of DCA requires you to continue purchasing shares relentlessly during terrifying headlines, bank failures, and geopolitical crises. The grimmer the news, the cheaper the shares you are acquiring.
- Step 5: Implement an Annual Step-Up. To combat inflation and align with career progression, increase your DCA contribution amount by 5% to 10% annually. This "Step-Up SIP" ensures your wealth accumulation rate scales proportionately with your earning power over decades.
Frequently Asked Questions
Q: Is it better to DCA weekly, monthly, or quarterly?
Extensive financial modeling shows that the difference in long-term terminal wealth between weekly, monthly, and quarterly DCA is statistically negligible over a 20-year horizon. The best frequency is simply the one that aligns with your income schedule. If you are paid monthly, a monthly DCA immediately following paycheck clearance minimizes cash drag and ensures consistency.
Q: Should I stop my DCA when the market is at an all-time high?
Absolutely not. Halting contributions at all-time highs is a form of market timing. Historically, markets spend a disproportionate amount of time near all-time highs. By stopping your automated investments, you will likely miss out on subsequent compounding. Trust the mathematical design of the system to average out costs over the long run.
Q: What happens if I use DCA on an individual stock that goes bankrupt?
This is the catastrophic vulnerability of using DCA on single equities. DCA relies on the premise that the asset will eventually recover. If you DCA into a fundamentally flawed company (e.g., Enron or Lehman Brothers), you are simply accelerating your wealth destruction by continuously throwing good money after bad. DCA must ideally be paired with diversified index funds or ETFs where the risk of the asset permanently going to zero is effectively eliminated.
Q: If I have a lump sum right now, what is the ideal timeframe to DCA it into the market?
If you choose to DCA a windfall for psychological comfort, the mathematical consensus suggests distributing it over a period of 6 to 12 months. Stretching a lump sum over 3 or 5 years introduces extreme cash drag, virtually ensuring severe underperformance relative to immediate investment, as inflation aggressively erodes the purchasing power of the uninvested capital.
See also
- Loading related topics...