Expense Ratios & Fees
1. The Anatomy of Mutual Fund Costs
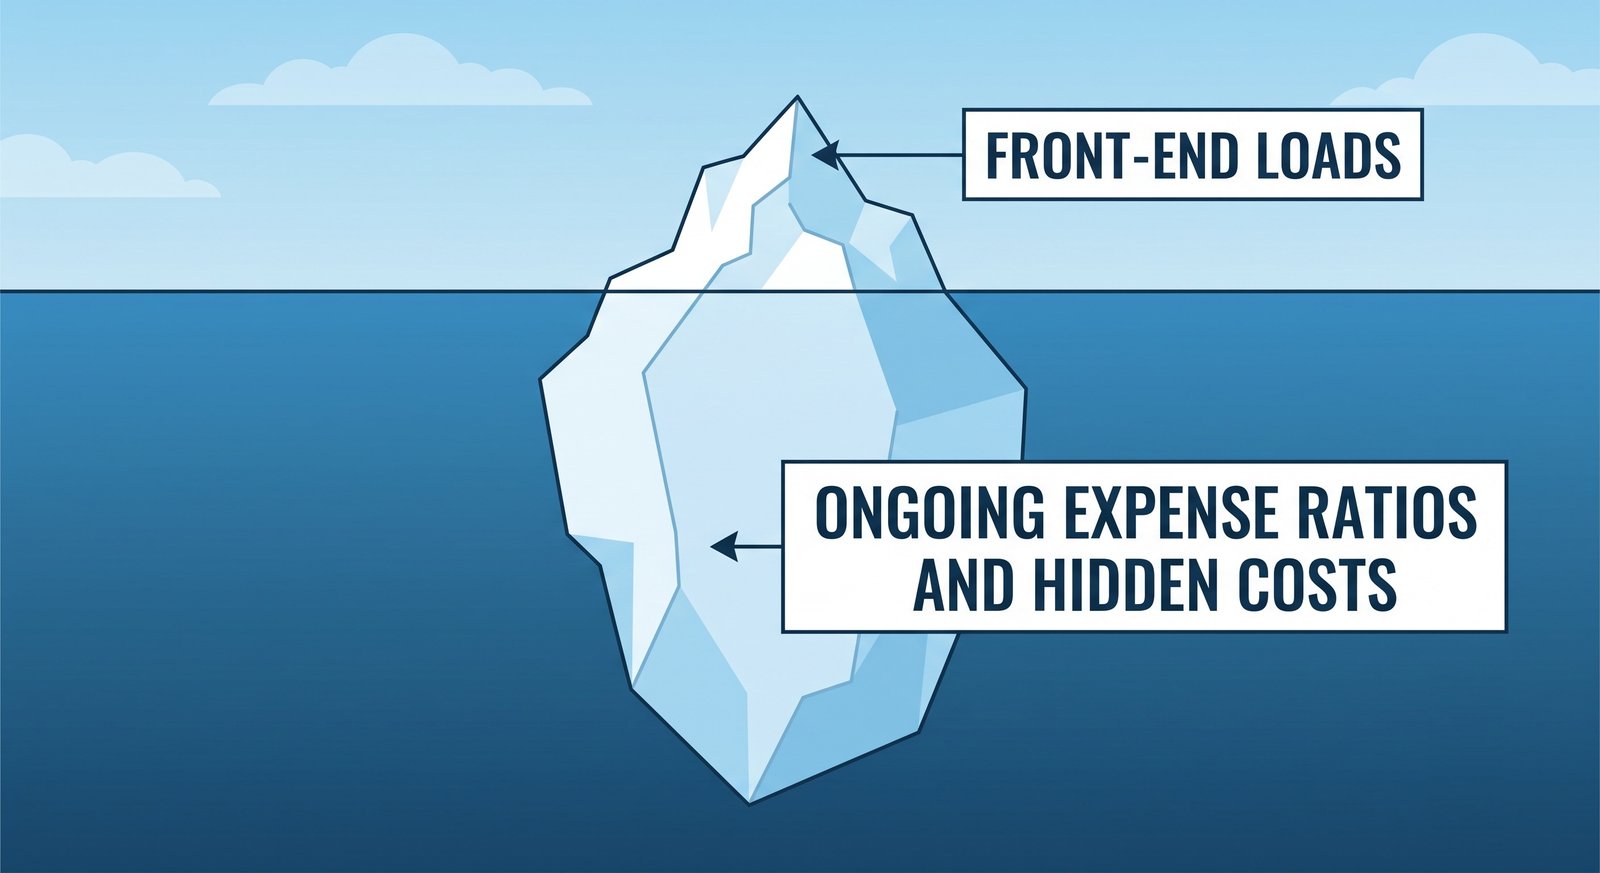
In the realm of wealth creation, understanding the mechanics of financial markets is secondary only to understanding the friction that drags on your returns. That friction primarily takes the form of Expense Ratios and associated investment fees. A mutual fund is not a charity; it is a complex corporate entity that incurs significant operational costs, including portfolio manager compensation, legal compliance, physical overhead, trading commissions, and marketing. These costs are invariably passed down to the investor.
The macroeconomic reality of investing is that gross returns in the market are identical for all participants in aggregate, but net returns—what the investor actually keeps—are heavily skewed by the intermediation costs. The Total Expense Ratio (TER) is the universal metric used to quantify this ongoing, annualized cost. Unlike a one-time commission or a transaction fee, the expense ratio is a silent partner in your portfolio, quietly extracting a percentage of your total assets every single year, regardless of whether the fund's underlying assets generate a profit or suffer a devastating loss.
Historically, the democratization of investing championed by figures like John Bogle brought the critical nature of these fees to light. By proving that high-fee, actively managed funds statistically underperform low-fee index funds over multi-decade horizons, the industry was forced into a "fee compression" phase. However, complex fee structures, hidden loads, and bloated 12b-1 marketing fees still permeate the financial landscape, making rigorous cost analysis a prerequisite for successful capital allocation.
2. Deep-Dive Explanations & Formulas
The mathematics behind mutual fund fees are elegant but unyielding. Investors often misunderstand how and when they pay these fees, assuming they receive an invoice or see a distinct line-item deduction on their monthly statements. In reality, expense ratios are baked into the daily pricing of the fund itself.
- The TER Formula: The Total Expense Ratio is calculated by dividing the fund's total operational costs by its average daily net assets.
TER = (Management Fees + Administrative Costs + 12b-1 Fees) / Average Net Assets.
For example, if a fund costs $10 million to run annually and manages $1 billion in assets, its TER is 1.00%. - Daily Accrual Mechanic: Funds do not deduct the TER once a year; they shave off a tiny fraction every single calendar day before the Net Asset Value (NAV) is published.
Daily Deduction = TER / 365.
If a fund has a 1.00% expense ratio, approximately 0.00274% of the fund's assets are liquidated daily to pay the fund company. This means the publicly reported NAV of a mutual fund is always "net of fees." - The Compounding Decay Formula: To calculate the devastating impact of fees over time, we use the future value formula with a reduced rate of return.
FV = P * (1 + (r - f))^n
Where P is the principal, r is the gross return, f is the expense ratio, and n is the number of years. The subtraction of f from r before compounding occurs is what leads to exponential wealth destruction in high-fee funds.
3. Case Study 1: The Silent Wealth Destroyer
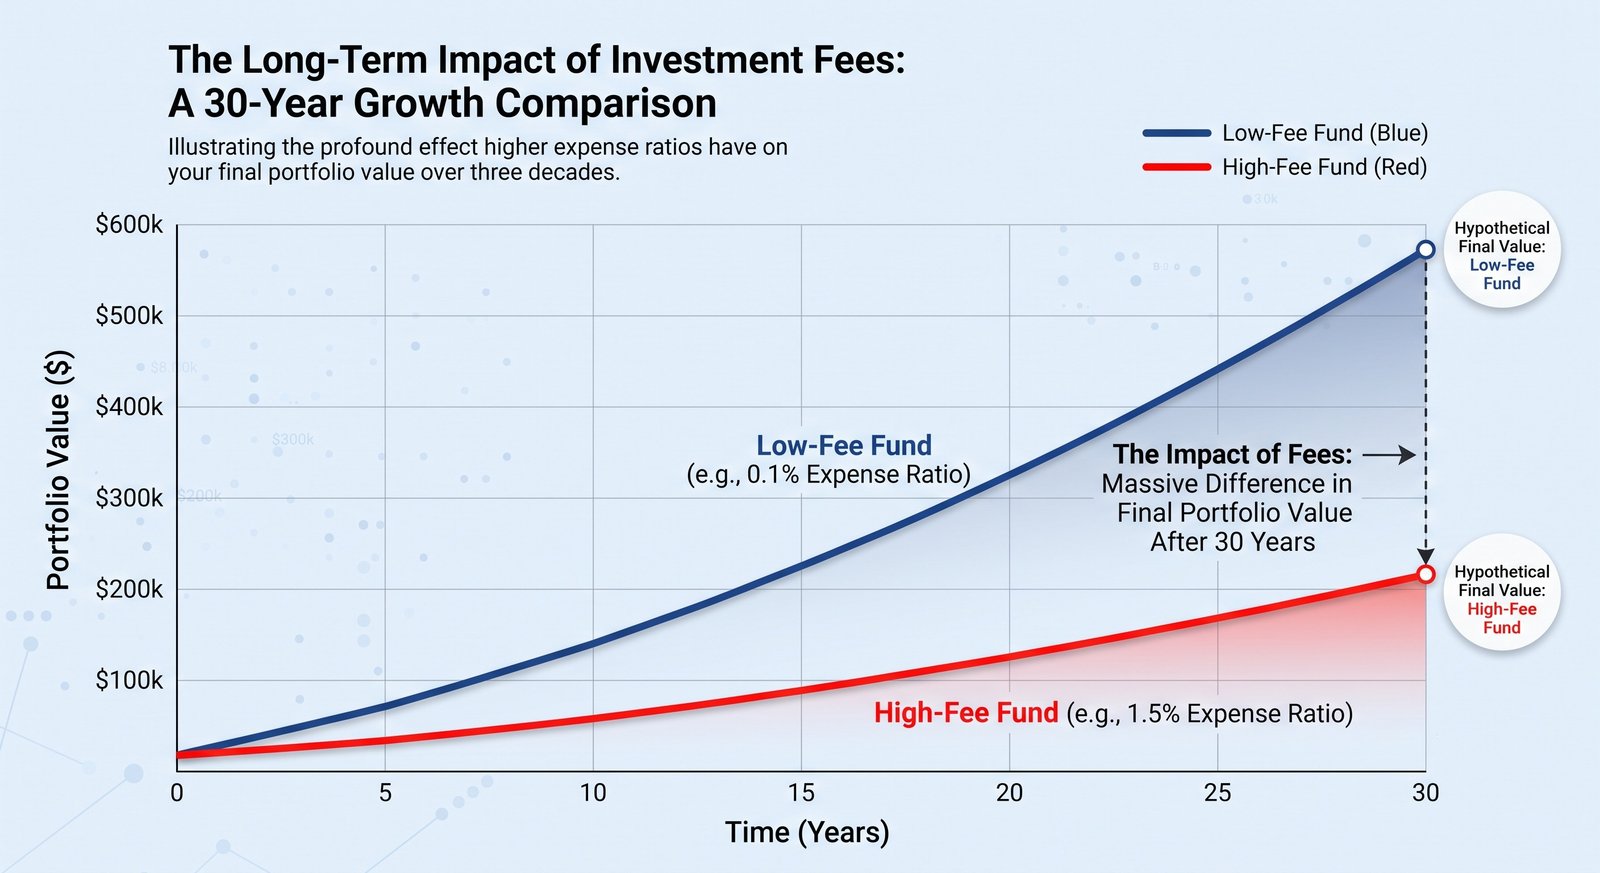
To contextualize the abstract percentages, let us examine a realistic scenario demonstrating how a seemingly harmless 1% difference in fees can drastically alter a retiree's standard of living.
Scenario: Consider two investors, Sarah and Marcus. Both are 30 years old, and both invest a lump sum of $100,000 into the equity market. The market will yield a gross annualized return of 8% over the next 30 years.
Sarah is cost-conscious and selects a broad-market passive index fund with an ultra-low Total Expense Ratio of 0.05%. Marcus, swayed by past performance marketing, selects an actively managed growth fund with an expense ratio of 1.25%. Over three decades, neither investor adds another dollar to their portfolios.
The Outcome: For Sarah, her net annualized return is 7.95% (8.00% - 0.05%). After 30 years, her $100,000 grows exponentially to $993,656. She successfully captures nearly all the wealth generated by the market.
For Marcus, his net annualized return is crippled to 6.75% (8.00% - 1.25%). After 30 years, his portfolio reaches just $709,837. Despite both investors taking on the exact same market risk, Marcus surrendered over $283,000 to his fund manager. More alarmingly, the fund company essentially confiscated over 28% of his potential final wealth simply for holding his assets. This case underscores a core financial law: in investing, you get exactly what you don't pay for.
4. Structural Breakdown: Loads, 12b-1 Fees, and Hidden Costs
The Total Expense Ratio is only one part of the cost equation. Many legacy mutual funds, especially those sold through traditional broker-dealers, utilize distinct "Share Classes" (e.g., Class A, Class B, Class C) that dictate complex commission structures known as "Loads."
- Front-End Loads (Class A Shares): A commission paid upfront when purchasing the fund. If a fund has a 5.00% front-end load and you invest $10,000, $500 is immediately skimmed off to pay the broker. Only $9,500 actually enters the market to generate returns.
- Back-End Loads / CDSC (Class B Shares): A Contingent Deferred Sales Charge. There is no upfront fee, but if you sell the fund within a specific timeframe (often 5-7 years), you are charged a penalty fee that gradually decreases to zero over time.
- Level Loads (Class C Shares): These funds typically have no front-end load and a 1% back-end load that expires after one year. However, they compensate the broker by artificially inflating the ongoing expense ratio, essentially bleeding the investor slowly over the lifespan of the investment.
- 12b-1 Fees: Named after a regulatory rule, these are fees embedded within the expense ratio strictly used for marketing and distributing the fund. Ironically, the existing investor pays a fee to help the fund company market itself to attract *new* investors, providing zero fundamental value to the current shareholder.
5. Structured Comparison Tables: Fee Profiles by Strategy
To make informed decisions, investors must evaluate funds across the active-passive spectrum and the share-class landscape. The following table contrasts standard metrics associated with varying fund types in today's financial environment.
| Fund Strategy & Structure | Typical Expense Ratio | Sales Loads & Commissions |
|---|---|---|
| Passive Index Fund (Institutional) | 0.01% - 0.05% | None (No-Load) |
| Active Equity Fund (No-Load Class) | 0.65% - 1.10% | None, but may contain 12b-1 fees |
| Active Equity (Class A Share) | 0.75% - 1.25% | Up to 5.75% upfront deduction |
| Active Equity (Class C Share) | 1.50% - 2.25% | 1.00% CDSC if sold in Year 1 |
6. Case Study 2: Front-End Loads and Breakpoint Discounts
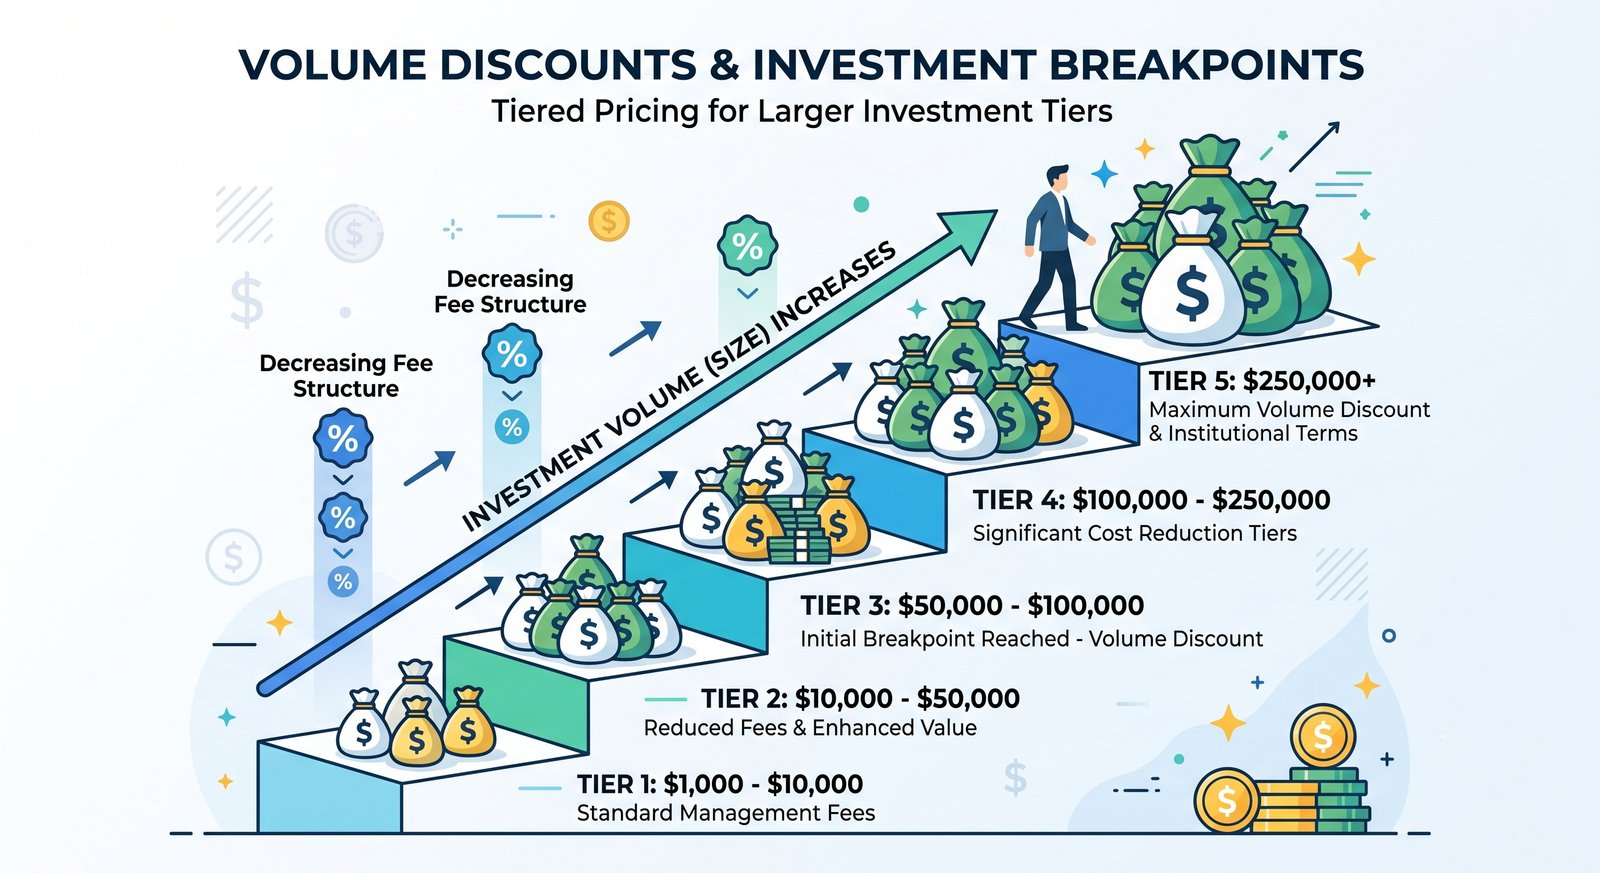
While modern, self-directed investors often avoid load funds entirely, those working with commissioned financial advisors often interact with them. If forced into a Class A share, understanding "Breakpoints" is mandatory to prevent gross overpayment.
Scenario: David wants to invest $48,000 into the XYZ Growth Fund (Class A). The fund prospectus outlines a strict front-end load schedule: Investments under $50,000 face a 5.75% commission. Investments between $50,000 and $99,999 trigger a "breakpoint" discount, dropping the commission to 4.50%.
The Outcome: If David proceeds with his $48,000 investment blindly, he pays $2,760 in fees immediately. Only $45,240 goes into the market. However, if David's advisor is acting as a true fiduciary, they will inform him of the breakpoint. By scraping together an additional $2,000 to reach the $50,000 threshold, David's fee percentage drops drastically. On the full $50,000, he pays 4.50%, which equals $2,250 in fees. By investing $2,000 *more* capital, David actually paid $510 *less* in fees, getting $47,750 working in the market. Understanding these structural tiers is vital when navigating legacy brokerage products.
7. Edge Cases and Macro-Market Anomalies
Fee structures behave predictably during bull markets, but macroeconomic shocks reveal edge cases that stress-test fund mechanics. One prominent anomaly is the Fee Waiver Crisis associated with Money Market Funds.
During periods of Zero-Interest Rate Policy (ZIRP)—such as the aftermath of the 2008 Financial Crisis and the 2020 pandemic response—the yield on ultra-short-term government debt dropped to near zero. If a money market fund held a gross yield of 0.15% but carried an expense ratio of 0.30%, the fund would theoretically generate a negative net return, breaking the sacrosanct "buck" (falling below a $1.00 NAV). To prevent mass investor panic and a run on the fund, asset management companies were forced to institute massive, emergency fee waivers. They voluntarily capped or absorbed their own expense ratios, running the funds at a loss to protect the investors' principal. This anomaly proves that expense ratios are not entirely static; they can be forcefully altered by systemic macroeconomic pressures.
8. Actionable Strategy Guide: Optimizing Your Cost Structure
Knowledge without execution is merely trivia. Follow this definitive, step-by-step strategy to purge unnecessary fees from your investment portfolio and maximize your compounded returns.
- Step 1: Audit Your Current Holdings. Log into your brokerage account and identify the ticker symbols of every mutual fund you own. Run them through a financial screening tool (like Morningstar or your broker's native interface) to locate the exact "Net Expense Ratio".
- Step 2: Enforce a Hard Threshold. Adopt a strict quantitative rule for future investments. For domestic broad-market index funds, refuse to pay an expense ratio higher than 0.10%. For specialized or international active funds, set a hard ceiling of 0.75%. Any fund above these marks must justify its cost with undeniable, risk-adjusted outperformance over a 10-year period.
- Step 3: Hunt for "No-Load" Funds. Absolutely refuse to pay front-end or back-end loads. The market is saturated with high-quality, commission-free alternatives. Look for funds labeled "No-Load" in their prospectus summary.
- Step 4: Consolidate to Institutional Classes. If you hold substantial capital (e.g., over $10,000 or $100,000 depending on the fund family), check if you qualify for "Admiral" or "Institutional" share classes. These classes offer the exact same underlying assets but charge a significantly lower expense ratio simply due to the volume of your investment.
- Step 5: Monitor Brokerage Transaction Fees. Be wary of secondary friction. Even if you find a fund with a 0.05% expense ratio, your specific brokerage platform might charge a $20 flat "Transaction Fee" every time you buy it because it is outside their preferred network. Ensure you trade within your broker's list of "No-Transaction-Fee (NTF)" funds.
9. Frequently Asked Questions (FAQ)
Q: Do I need to write a check to pay my mutual fund's expense ratio?
No. Expense ratios are seamless and automatically deducted internally by the fund's management. A tiny fraction of the fee is extracted daily from the total pool of assets before the fund's end-of-day Net Asset Value (NAV) is reported to the public. You never see a direct bill, which is exactly why they are so easy for investors to ignore.
Q: Are higher-fee funds more likely to generate higher returns?
Historically, the exact opposite is true. Decades of academic and empirical data demonstrate an inverse relationship between fund cost and long-term net performance. High costs create a massive hurdle that the fund manager must clear just to break even with the market benchmark. Over a 10-to-20 year period, the vast majority of high-fee active managers fail to consistently beat low-fee passive index funds.
Q: What is the difference between Gross Expense Ratio and Net Expense Ratio?
The Gross Expense Ratio reflects the total, actual operational costs of the fund. However, fund companies will sometimes offer temporary fee waivers or reimbursements to make a new fund more attractive. The Net Expense Ratio reflects what you actually pay *after* these waivers are applied. Always pay attention to the Net figure, but be aware of the exact date when the fee waivers are scheduled to expire.
Q: Can I deduct mutual fund expense ratios on my personal income taxes?
In the vast majority of jurisdictions, including the US under current tax laws, you cannot directly deduct mutual fund operating expenses or expense ratios on your personal tax return. These costs simply lower your gross investment yield, meaning you automatically pay taxes on a smaller net gain.
Q: Are ETF fees lower than Mutual Fund fees?
Generally, yes, though the gap is closing. Exchange-Traded Funds (ETFs) inherently have lower structural overhead because they do not have to maintain individual shareholder accounts or process daily cash redemptions like mutual funds do. Consequently, passive ETFs frequently carry the lowest expense ratios in the industry, sometimes as low as 0.03% or even 0.00%.
See also
- Loading related topics...