Fundamental Analysis Basics
The Ultimate Guide to Valuing Stocks, Understanding Financial Statements, and Identifying Intrinsic Value
Fundamental analysis is the cornerstone of modern investing, functioning as the primary methodology used by legendary investors like Benjamin Graham, Warren Buffett, and Peter Lynch. At its core, fundamental analysis is the rigorous process of examining a company's underlying business health, macroeconomic environment, and financial metrics to determine its intrinsic value. The ultimate goal is to ascertain whether a security is currently undervalued or overvalued by the broader market, thereby making an informed investment decision based on data rather than market sentiment or momentum.
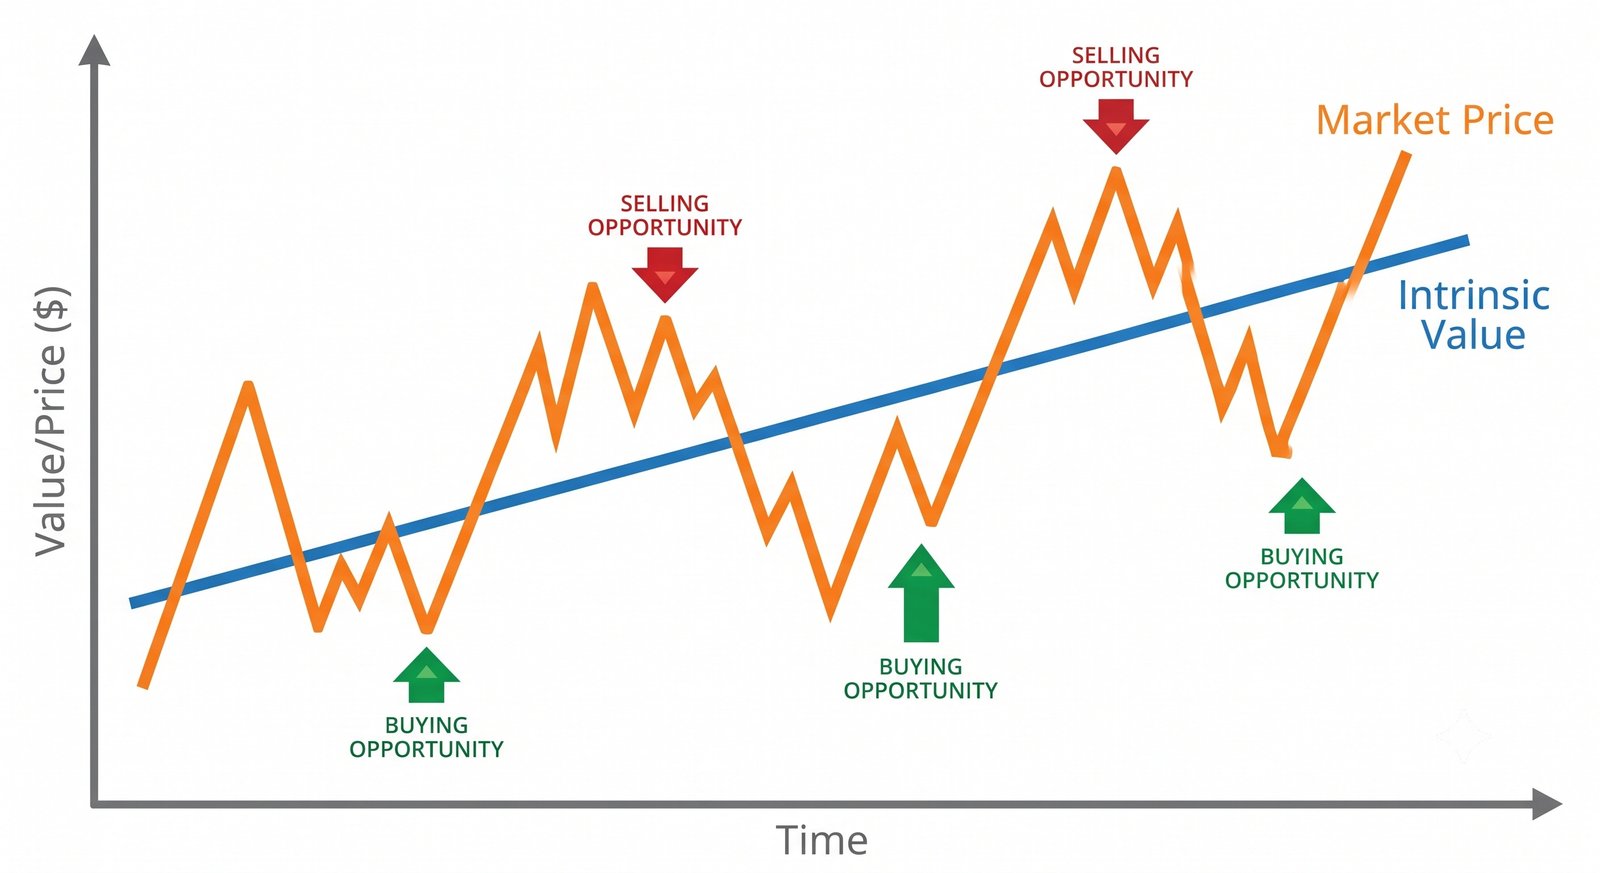
To master fundamental analysis, an investor must learn to speak the language of business: accounting. This involves a deep dive into financial statements—the Income Statement, the Balance Sheet, and the Cash Flow Statement—combined with a holistic understanding of macroeconomic indicators, industry cycles, and qualitative factors such as management competence and brand equity. In this definitive guide, we will break down the complex mechanics of fundamental analysis, provide actionable strategy guides, and explore mathematical formulas essential for long-term wealth creation.
The Core Mechanics: Deconstructing Financial Statements
The foundation of any bottom-up fundamental analysis lies within a company's financial statements, generally filed quarterly (10-Q) and annually (10-K) with regulatory bodies like the SEC. These documents act as the company's financial scorecard.
- The Income Statement (P&L): This statement reveals the company's financial performance over a specific period. It starts with the "top line" (Revenue or Sales) and deducts the Cost of Goods Sold (COGS), operating expenses, interest, and taxes to arrive at the "bottom line" (Net Income). Analysts scrutinize this to evaluate profit margins and revenue growth trajectories.
- The Balance Sheet: A snapshot of a company's financial standing at a single point in time. It follows the fundamental accounting equation: Assets = Liabilities + Shareholders' Equity. It is crucial for assessing a company's liquidity, solvency, and capital structure.
- The Cash Flow Statement: While net income can be manipulated through accounting practices (accruals), cash flow represents the actual cash entering and exiting the business. It is divided into Cash from Operations (CFO), Cash from Investing (CFI), and Cash from Financing (CFF). Operating cash flow and Free Cash Flow (FCF) are the lifeblood of business sustainability.
Deep-Dive Explanations & Formulas: The Metrics That Matter
Raw data from financial statements must be converted into standardized ratios to allow for peer-to-peer and historical comparisons. Below are the most critical formulas used by fundamental analysts, explained in extreme detail.
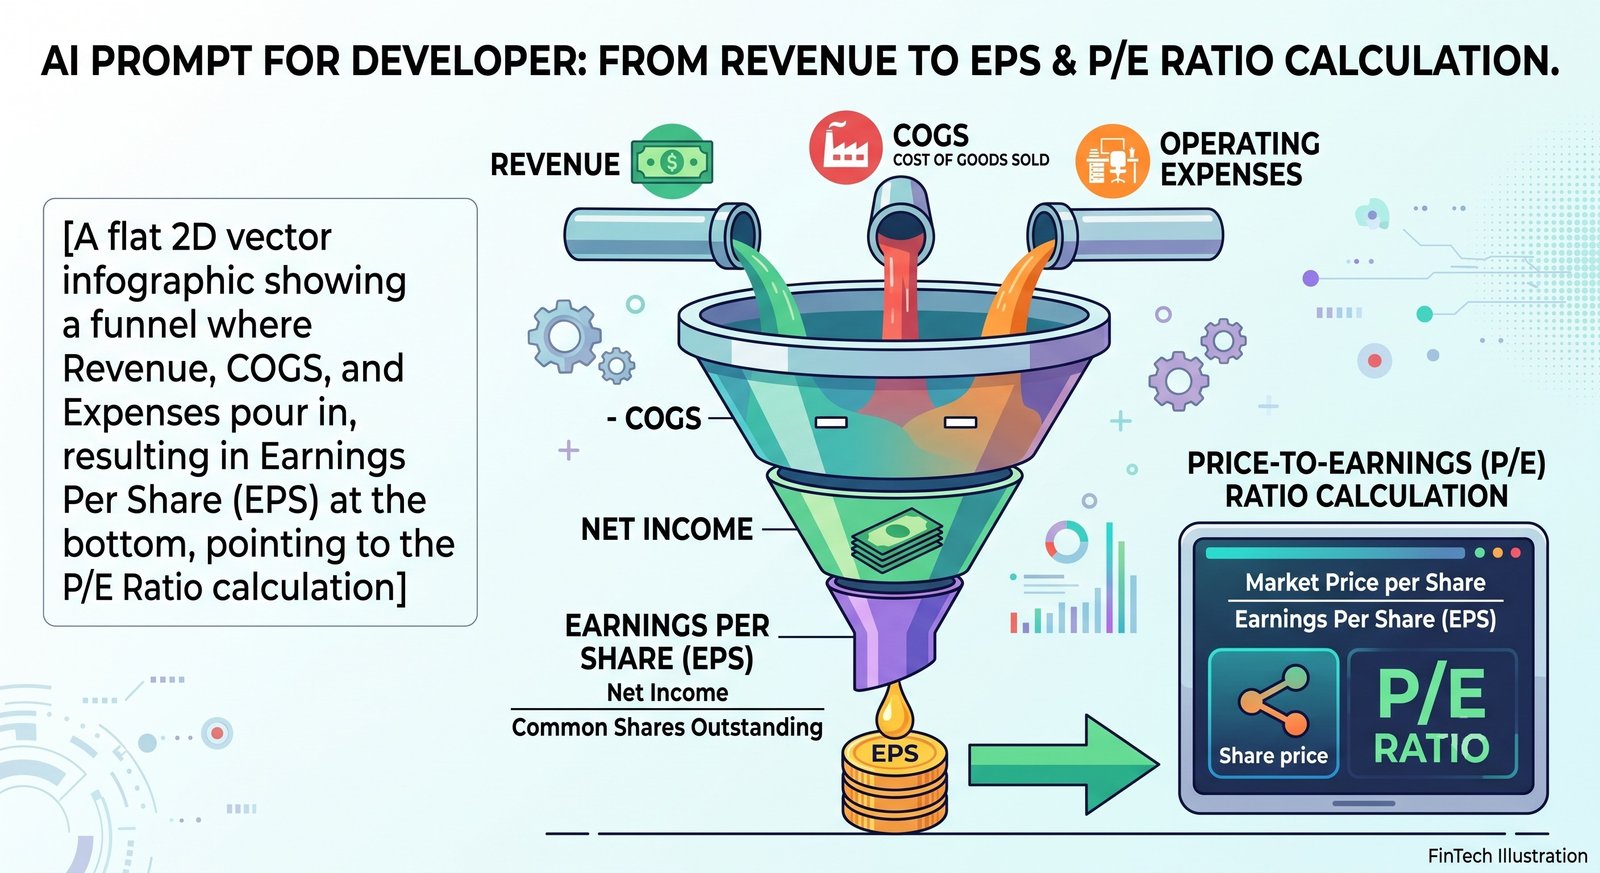
- Earnings Per Share (EPS): The portion of a company's profit allocated to each outstanding share of common stock. It serves as an indicator of profitability.
Formula: EPS = (Net Income - Preferred Dividends) / Weighted Average Shares Outstanding - Price-to-Earnings (P/E) Ratio: The most ubiquitous valuation metric, comparing the current share price to its per-share earnings. A high P/E suggests investors expect higher future growth, while a low P/E may indicate undervaluation (or fundamental distress).
Formula: P/E Ratio = Current Market Price per Share / Earnings Per Share - Price/Earnings-to-Growth (PEG) Ratio: An enhancement of the P/E ratio that factors in the expected earnings growth rate, providing a more complete picture, particularly for growth stocks. A PEG ratio of 1.0 is traditionally considered "fair value."
Formula: PEG = (P/E Ratio) / Annual EPS Growth Rate - Return on Equity (ROE): Measures financial performance calculated by dividing net income by shareholders' equity. It dictates how effectively management is utilizing investors' capital to generate profit.
Formula: ROE = Net Income / Average Shareholders' Equity - Free Cash Flow (FCF): The cash a company produces through its operations, minus the cost of expenditures on assets (CapEx). FCF is cash that can be freely distributed to shareholders via dividends or buybacks without jeopardizing operations.
Formula: FCF = Operating Cash Flow - Capital Expenditures
Macroeconomic Factors: Top-Down vs. Bottom-Up Approaches
Fundamental analysis operates on two primary wavelengths: Top-Down and Bottom-Up. A Top-Down approach begins by analyzing the broader macroeconomic environment—looking at GDP growth rates, Central Bank interest rate policies, inflation (CPI), and currency fluctuations. The analyst identifies thriving sectors within this macroeconomic framework and only then selects individual stocks within those sectors.
Conversely, the Bottom-Up approach, favored by investors like Warren Buffett, completely ignores the macroeconomic noise. It focuses solely on the microeconomic reality of a specific business. Bottom-up analysts believe that highly exceptional companies will consistently outperform their peers and the broader market regardless of whether the overall economy is in a recession or expansion. In practice, the most astute investors use a hybrid approach, recognizing that even the greatest companies face headwinds during severe macroeconomic tightening cycles.
Case Study 1: The Value Trap vs. The Value Play
A common pitfall in fundamental analysis is the "Value Trap"—a stock that appears incredibly cheap based on traditional valuation metrics (like a low P/E or P/B ratio) but is actually a dying business. Let us examine a realistic scenario involving two fictional companies in the manufacturing sector: TechNova Industries (The Value Play) and StableCorp Manufacturing (The Value Trap).
StableCorp is trading at a seemingly bargain P/E of 6.5x, with a high dividend yield of 8%. However, a deep dive into their cash flow statement reveals that their operating cash flow has declined by 15% year-over-year for three consecutive years. They are funding their 8% dividend by taking on high-interest long-term debt, destroying shareholder equity. Their "cheap" P/E is a reflection of the market accurately pricing in their impending insolvency.
In contrast, TechNova is trading at a P/E of 14x. While more expensive than StableCorp, TechNova has consistently grown its Free Cash Flow by 12% annually, boasts a Return on Equity (ROE) of 22%, and holds zero long-term debt. TechNova is temporarily discounted because of a short-term supply chain disruption that the market has overreacted to. TechNova represents intrinsic value; StableCorp represents a value trap.
| Fundamental Metric | StableCorp (Value Trap) | TechNova (Value Play) |
|---|---|---|
| P/E Ratio (Trailing) | 6.5x | 14.0x |
| Debt-to-Equity Ratio | 2.4 (High Risk) | 0.1 (Low Risk) |
| 3-Yr FCF Growth Rate | -15.0% (Declining) | +12.0% (Growing) |
| Return on Equity (ROE) | 4.5% | 22.0% |
Case Study 2: Growth at a Reasonable Price (GARP)
Pure value investing is not the only methodology within fundamental analysis. GARP investing seeks to combine the best of both value and growth investing. Let us evaluate EcoDrive Motors, a fictional mid-cap electric vehicle components manufacturer. EcoDrive trades at a relatively high P/E ratio of 35x. To a traditional value investor, this immediately triggers a "do not buy" signal.
However, a GARP analyst calculates the PEG ratio. EcoDrive has secured long-term contracts that guarantee annual earnings growth of 45% for the next three years. Using the formula (PEG = P/E ÷ Growth Rate), we calculate EcoDrive's PEG as (35 / 45) = 0.77. Because the PEG ratio is well below 1.0, fundamental analysis reveals that despite the "expensive" P/E ratio, the stock is actually undervalued relative to its explosive, highly visible earnings trajectory. The analyst buys the stock, confident that future earnings compression will justify the current premium.

Actionable Strategy Guide: How to Analyze a Stock Step-by-Step
Executing fundamental analysis requires a structured, repeatable workflow to strip away emotional bias. Follow this step-by-step framework to evaluate any public security:
- Step 1: Understand the Business Model. Never buy a business you do not understand. Read the "Item 1: Business" section of the company's latest 10-K filing. How do they make money? Who are their customers? What are their operating margins?
- Step 2: Check Solvency and Liquidity. Before looking at profits, ensure the company will survive. Review the Balance Sheet. Calculate the Current Ratio (Current Assets / Current Liabilities) to ensure it is above 1.5. Check the Debt-to-Equity ratio to ensure they are not over-leveraged compared to industry peers.
- Step 3: Analyze Profitability and Cash Flow. Move to the Income and Cash Flow statements. Has revenue grown consistently over the last 5 years? Is net income tracking alongside revenue? Most importantly, is Operating Cash Flow consistently positive and converting into Free Cash Flow?
- Step 4: Assess Qualitative Moats. Does the company possess an "Economic Moat"? Look for brand loyalty, high switching costs, network effects, or cost advantages. A company without a moat will eventually see its margins destroyed by competition.
- Step 5: Perform Valuation Modeling. Finally, use valuation metrics (P/E, PEG, Price-to-Free-Cash-Flow) and advanced models like the Discounted Cash Flow (DCF) model to estimate the intrinsic value per share. If the current market price offers a "Margin of Safety" (typically trading 20-30% below intrinsic value), execute the trade.
Advanced Edge Cases & Accounting Nuances
Fundamental analysis is rarely black and white. Seasoned analysts must navigate edge cases. For instance, analyzing cyclical stocks (like semiconductors or commodity miners) requires inverting traditional rules. A cyclical stock is often most dangerous when its P/E ratio is lowest (peak cycle earnings) and most attractive when its P/E ratio is astronomically high (trough earnings right before an upcycle).
Furthermore, investors must account for the impact of massive share buyback programs. A company buying back 5% of its outstanding shares annually will show artificial EPS growth even if net income is completely flat. Analysts must dig into the absolute net income figures to separate financial engineering from organic business growth. Additionally, one must watch for accounting red flags—such as days sales outstanding (DSO) growing much faster than revenue, which indicates the company is struggling to collect cash from its clients.
Frequently Asked Questions (FAQs)
Q: What is the difference between fundamental analysis and technical analysis?
Fundamental analysis focuses on the underlying business health, financial statements, and intrinsic value of a company to determine long-term investments. Technical analysis, conversely, completely ignores the underlying business and focuses solely on statistical trends gathered from trading activity, such as price movement, momentum, and volume charts, to predict short-term market behavior.
Q: What is a "Margin of Safety" in fundamental analysis?
Coined by Benjamin Graham, a margin of safety is the principle of purchasing securities only when their market price is significantly below their calculated intrinsic value. This discount acts as a buffer to protect the investor against human error in their valuation models, unforeseen economic downturns, or sudden competitive threats to the business.
Q: Why do fundamental investors prioritize Free Cash Flow over Net Income?
Net income includes non-cash expenses (like depreciation and amortization) and is subject to complex accrual accounting rules, making it easier for management to legally manipulate or smooth out earnings. Free Cash Flow (FCF) represents the hard, tangible cash that entered the bank account minus capital expenditures. As the saying goes: "Profit is an opinion; cash is a fact."
Q: How does inflation impact fundamental analysis models?
Inflation drastically impacts fundamental models, specifically the Discounted Cash Flow (DCF) model. When inflation rises, central banks raise interest rates, which directly increases the "discount rate" used in the DCF. A higher discount rate heavily penalizes future cash flows, leading to a lower present intrinsic value. This is why high-growth tech stocks often plummet when inflation data comes in hotter than expected.
Q: Is fundamental analysis useful for day trading?
Generally, no. Fundamental analysis is designed for long-term horizons (years or decades) because it takes time for the stock market to correctly weigh and reflect the intrinsic value of a business. Day traders rely almost entirely on technical analysis, market sentiment, and price action to capitalize on intraday volatility, which often has zero correlation to the company's long-term financial fundamentals.
See also
- Loading related topics...