Government vs Corporate Bonds
The Ultimate Guide to Navigating Sovereign Debt, Credit Spreads, and Fixed Income Allocation
The global fixed-income market is a colossal financial engine, dwarfing the equity markets in both size and systemic importance. With over $130 trillion in outstanding debt worldwide, this ecosystem dictates the cost of capital, fuels sovereign spending, and provides the necessary leverage for corporate expansion. At the very heart of this market lies a fundamental dichotomy: the choice between lending capital to a sovereign nation (Government Bonds) versus lending to a private enterprise (Corporate Bonds). Understanding the intricate mechanical, mathematical, and macroeconomic differences between these two instruments is the absolute bedrock of modern portfolio theory and risk management.
While both instruments are fundamentally debt securities—legal contracts where the issuer promises to pay a specified interest rate (coupon) and return the principal upon maturity—their risk profiles, pricing mechanisms, and behaviors during economic shocks differ profoundly. Government bonds, specifically those issued by developed nations in their own fiat currency, serve as the baseline "risk-free" benchmark for the entire financial system. Conversely, corporate bonds introduce credit risk, requiring sophisticated mathematical modeling to price the probability of default against the promise of higher yields.
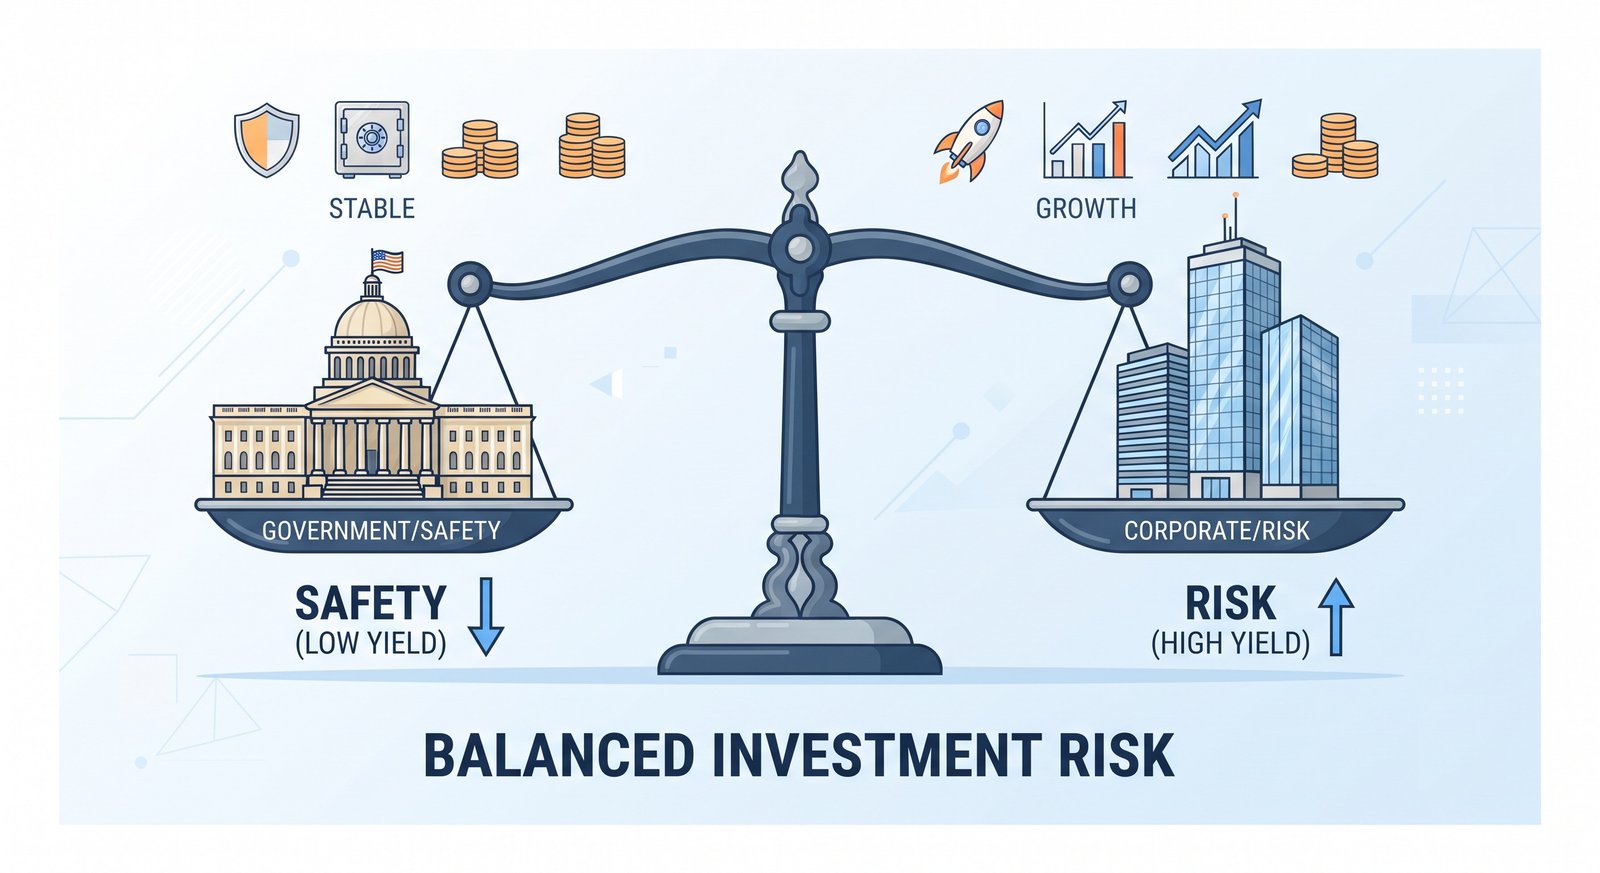
1. The Macroeconomic Architecture of Government Bonds
Government bonds (sovereign debt) are issued by national governments to fund public spending, manage national deficits, and execute macroeconomic policy. The most liquid and systemically important of these are U.S. Treasuries, UK Gilts, German Bunds, and Japanese Government Bonds (JGBs). Because these nations possess the power of taxation and control their own central banks (the ability to print fiat currency), their domestic-denominated debt is generally considered free of default risk.
However, "risk-free" does not mean "immune to loss." Investors in government bonds face two distinct macroeconomic threats: Interest Rate Risk and Inflation Risk. If a central bank aggressively raises baseline interest rates to combat inflation, the fixed coupons of previously issued government bonds become less attractive, causing their secondary market prices to plummet. This was violently demonstrated during the 2022 global tightening cycle, where long-duration sovereign bonds suffered historic double-digit drawdowns.
- The Yield Curve: Government bonds form the sovereign yield curve, a graphical representation of yields across different maturities (e.g., 1-month to 30-year). This curve acts as the baseline discounting rate for every other asset class in the world.
- Quantitative Easing (QE): Central banks actively manipulate government bond prices. By purchasing massive quantities of their own sovereign debt, central banks artificially drive up bond prices and suppress yields, forcing investors further out on the risk spectrum into corporate bonds and equities.
2. The Dynamics and Default Mechanics of Corporate Bonds
Corporate bonds are debt securities issued by private and public companies to finance daily operations, mergers and acquisitions, capital expenditures, or stock repurchases. Unlike governments, corporations cannot tax citizens or print money. If a corporation fails to generate sufficient cash flow, it will default on its debt obligations. This introduces Credit Risk into the pricing equation.
The corporate bond market is highly stratified, governed by Credit Rating Agencies (Standard & Poor's, Moody's, and Fitch) which assign letter grades based on the issuer's balance sheet health, cash flow predictability, and leverage ratios.
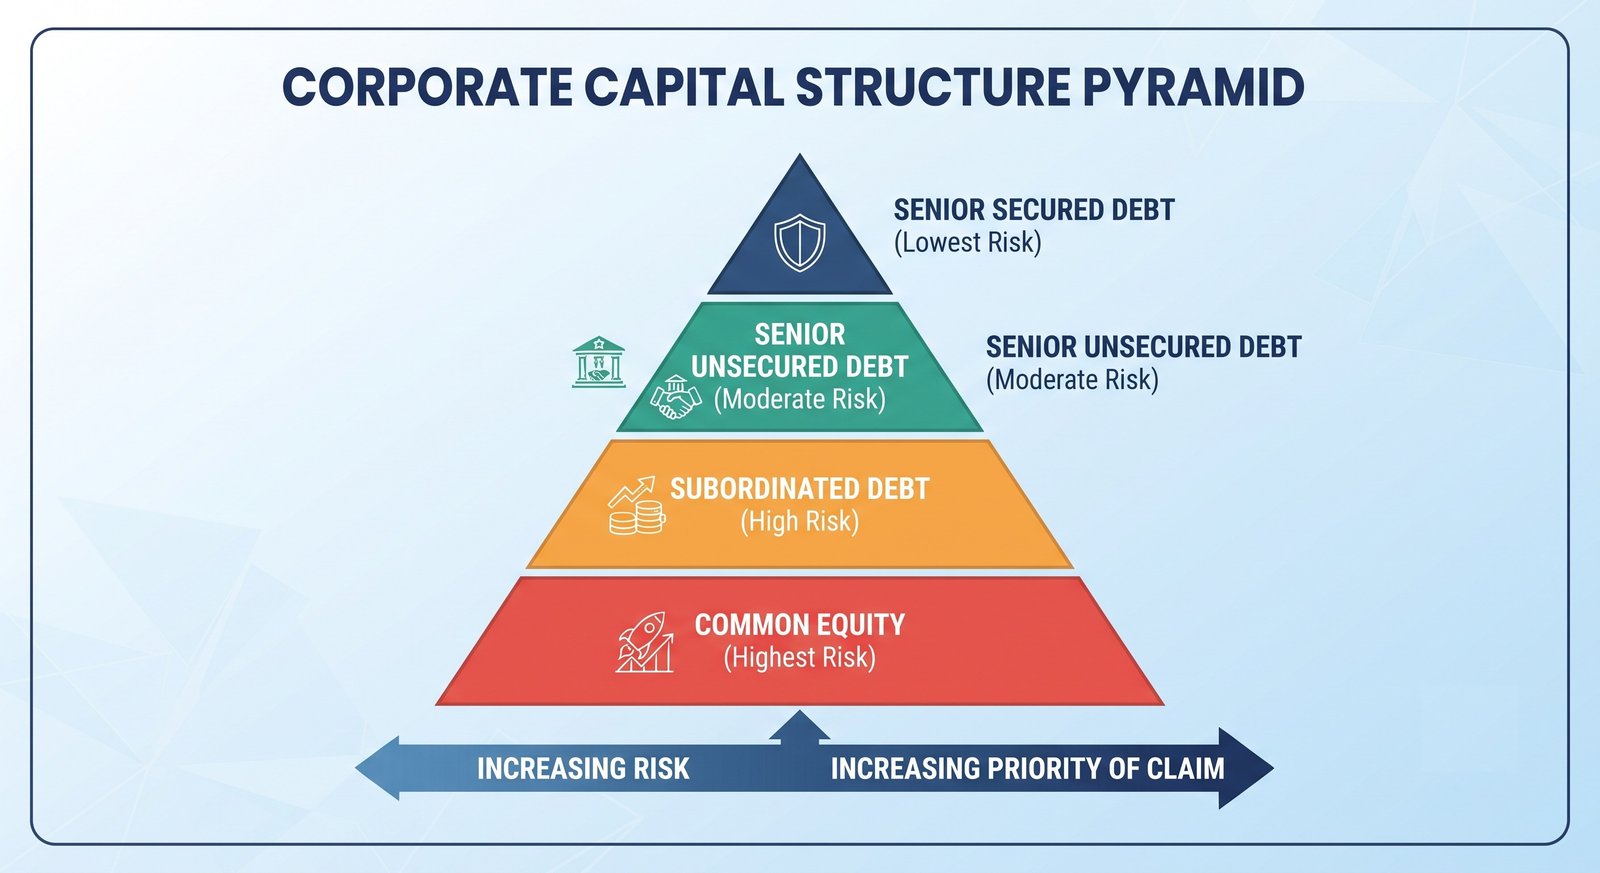
- Investment Grade (IG): Rated AAA to BBB-. These are issued by massive, financially stable conglomerates (e.g., Apple, Microsoft). They offer lower yields but possess statistical default probabilities approaching zero in the short term.
- High-Yield (Junk Bonds): Rated BB+ and below. Issued by highly leveraged companies or startups. They compensate investors for intense default risk by offering significantly higher coupon payments.
- The Absolute Priority Rule: In the event of bankruptcy, corporate bondholders are paid before equity shareholders. Furthermore, corporate debt is tranched. Senior Secured Debt (backed by physical assets) is paid out first, followed by Senior Unsecured Debt, and finally Subordinated Debt.
3. Deep-Dive Explanations & Mathematical Valuations
To intelligently invest across both sectors, one must master the underlying mathematics of bond pricing and credit spreads. The baseline valuation for any bond is the Present Value (PV) of its future cash flows, discounted by the required yield to maturity (YTM).
P = ∑t=1N [ C / (1+YTM)t ] + [ FV / (1+YTM)N ]
Where P is the bond price, C is the coupon payment, FV is the face value, t is the time period, and N is the total number of periods. For a government bond, the YTM is essentially the risk-free rate for that duration. However, for a corporate bond, the required yield is constructed differently. It is the sum of the risk-free rate plus a Credit Spread.
YTMCorp = YTMGov + Credit Spread + Liquidity Premium
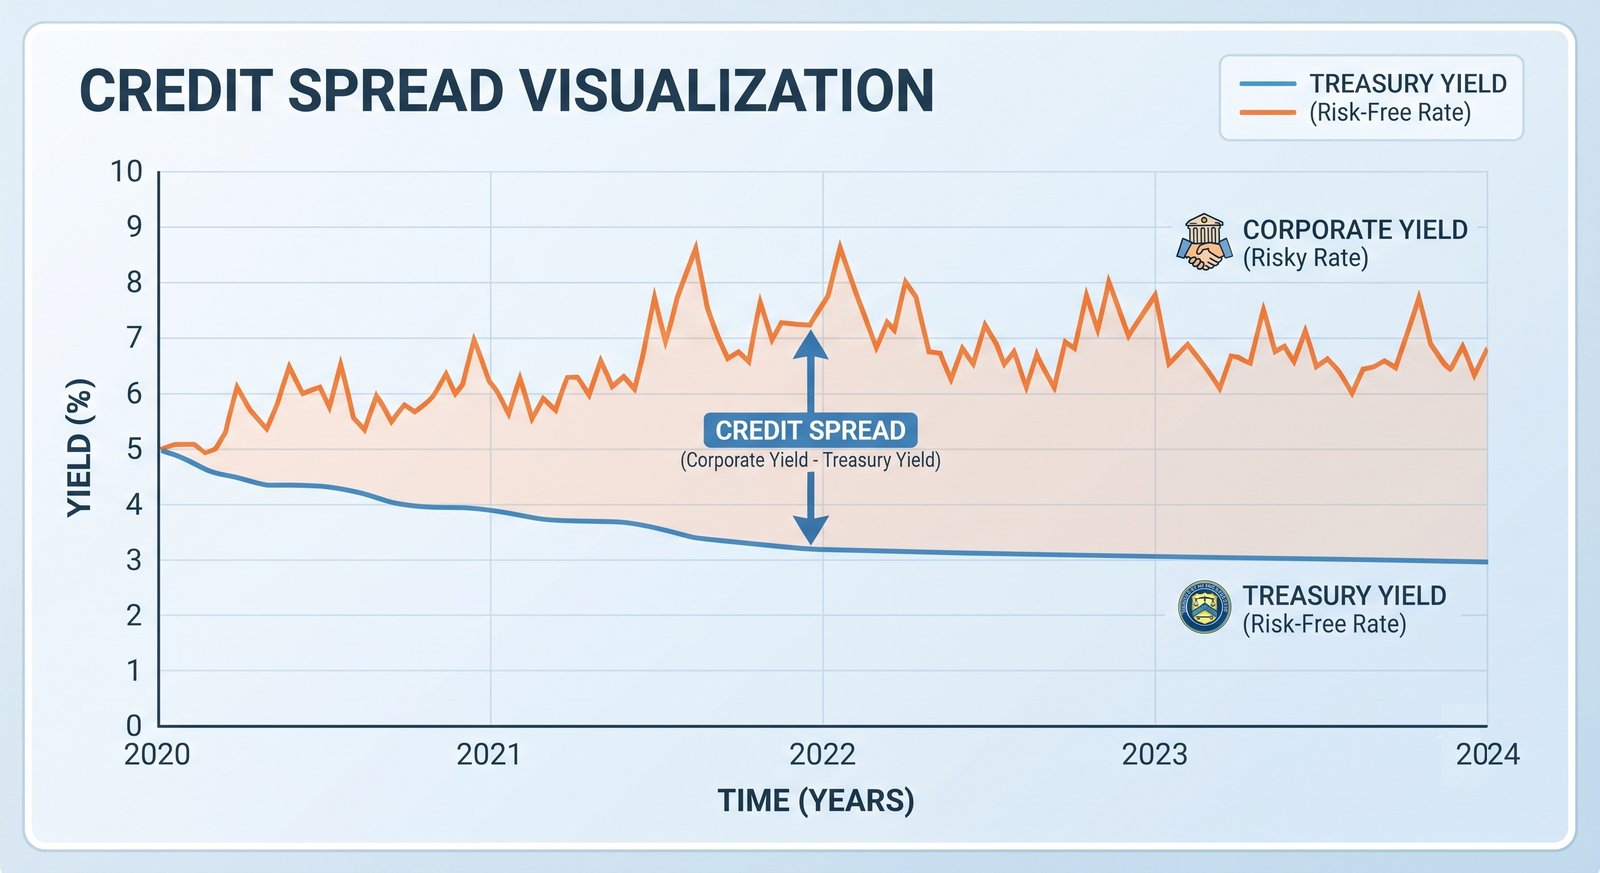
The Mechanics of the Spread: The Credit Spread (often measured in basis points, where 100 bps = 1.00%) represents the exact mathematical compensation an investor demands for taking on the probability of a corporate default. During periods of economic expansion, credit spreads compress (narrow) because corporate earnings are strong, and default risk is perceived to be low. During recessions, credit spreads blow out (widen). When spreads widen, the required YTMCorp increases, which forces the price of the corporate bond down, even if government yields remain static.
To accurately calculate the expected loss on a corporate bond portfolio, institutional risk managers use the following equation:
Expected Loss = Probability of Default (PD) × Loss Given Default (LGD) × Exposure at Default (EAD)
Because Government bonds in a domestic currency theoretically have a Probability of Default (PD) of zero, the Expected Loss is zero, isolating their pricing strictly to interest rate duration metrics (Macaulay and Modified Duration).
4. Structured Comparison Table: Sovereign vs. Corporate Risk Matrix
The decision to allocate between government and corporate issues depends on a multitude of factors, including tax implications, liquidity needs, and macroeconomic timing. The following table synthesizes these structural differences.
| Metric / Characteristic | Government Bonds (e.g., U.S. Treasuries) | Corporate Bonds (IG and High Yield) |
|---|---|---|
| Primary Risk Factor | Interest Rate Risk & Inflation. | Credit/Default Risk & Economic Contraction. |
| Yield Potential | Baseline / Lowest in the market (Risk-Free Rate). | Higher. Yields scale proportionally with credit downgrades. |
| Taxation (U.S. Example) | Exempt from State and Local taxes. Subject to Federal tax. | Fully taxable at Federal, State, and Local levels. |
| Market Liquidity | Deepest, most liquid market globally. Easy to trade in billions. | Variable. IG is highly liquid; High-Yield can become deeply illiquid during panics. |
| Behavior during Recession | Prices typically surge (yields drop) due to a "flight to safety." | Prices plummet as spreads widen and default probabilities spike. |
5. Realistic Case Studies: Stress Testing the Theories
Theoretical mechanics are best understood through application. The following case studies illustrate how government and corporate bonds diverge violently under different macroeconomic conditions.
Case Study 1: The "Flight to Quality" Macro Shock
Consider an institutional investor managing a $100 Million portfolio. The portfolio holds $50M in 10-Year U.S. Treasuries yielding 4.0% and $50M in 10-Year BBB-rated Corporate Bonds issued by "Global Logistics Corp" yielding 5.5%. The Credit Spread is currently 150 basis points (1.5%).
Suddenly, a severe, unexpected global recession hits. Supply chains freeze, and corporate revenues collapse. The market enters a panic.
- The Government Bond Reaction: Investors dump equities and panic-buy U.S. Treasuries for absolute safety. This massive demand pushes the price of the 10-Year Treasury up, driving its yield down from 4.0% to 2.5%. The investor realizes a massive capital gain on the Treasury allocation due to positive duration effects.
- The Corporate Bond Reaction: Simultaneously, the market realizes Global Logistics Corp might struggle to pay its debts during a recession. Investors demand a higher risk premium. The Credit Spread blows out from 150 bps to 450 bps.
- The Mathematical Result: The new required yield for the Corporate bond is the new Treasury yield (2.5%) + the new spread (4.5%) = 7.0%. Because the required yield spiked from 5.5% to 7.0%, the price of the corporate bond plummets. In this scenario, despite holding the same duration, the government bond generated massive gains while the corporate bond suffered severe losses, proving that corporate bonds exhibit equity-like volatility during crises.
Case Study 2: Yield Chasing in a ZIRP (Zero Interest Rate Policy) Environment
A pension fund requires a strict 6% annual return to meet its actuarial liabilities to retirees. The Central Bank initiates a Zero Interest Rate Policy, driving 10-Year Government bond yields down to 1.5%.
The pension fund mathematically cannot survive by allocating to "risk-free" government debt. To achieve the 6% target, the fund managers are forced down the credit spectrum. They sell their AAA government bonds and construct a portfolio of BB-rated "Junk" Corporate Bonds yielding 6.5% issued by emerging software and energy firms. While they successfully meet their yield target in the short term, they have fundamentally transformed the risk architecture of the pension fund. If a sector-specific shock hits the energy market, a chain reaction of defaults could wipe out the fund's principal, illustrating how low government rates force systemic risk-taking in the corporate sector.
6. Actionable Strategy Guide: Structuring a Hybrid Bond Portfolio
Modern portfolio allocation requires a tactical blend of both government and corporate debt. Follow this systematic approach to optimize yield while defending against catastrophic drawdowns.
- Step 1: Define the Liquidity and Safety Baseline (The Core). Allocate 30% to 50% of your fixed-income portfolio directly into short-to-medium-term Government Bonds (e.g., 2-Year to 5-Year Treasuries). This capital acts as the ultimate shock absorber. In a market crash, this portion will remain highly liquid and maintain its value, allowing you to sell it at a premium to buy cheap equities.
- Step 2: Calculate the Tax-Equivalent Yield. Before buying a Corporate bond, assess your tax bracket. A corporate bond yielding 6% might result in less actual cash in your pocket than a tax-free municipal or state-tax-exempt government bond yielding 4.5%, depending on local tax laws. Always evaluate corporate bonds on an after-tax basis.
- Step 3: Deploy the "Satellite" Corporate Allocation. Allocate the remaining capital to Investment Grade corporate bonds to boost portfolio yield. Use bond ETFs (Exchange Traded Funds) for corporate exposure rather than buying individual bonds. Buying a single corporate bond concentrates too much idiosyncratic default risk. An ETF spreads that risk across hundreds of issuers.
- Step 4: Monitor the Credit Spread as a Macro Indicator. Track the "ICE BofA US High Yield Index Option-Adjusted Spread" (freely available via economic databases like FRED). If you see this spread rapidly widening from 3% to 5%+, it signals that institutional credit markets are pricing in an impending recession. Use this signal to reduce corporate exposure and pivot back to government debt before the equity markets catch on.
- Step 5: Utilize a Barbell Duration Strategy. Keep corporate bonds on the short end of the duration curve (1 to 3 years) to limit exposure to default risk over time. Keep government bonds on the longer end of the curve (10+ years) to maximize their price appreciation potential during a crisis.
7. Frequently Asked Questions (FAQs)
Q: Can a Government Bond ever default?
Yes, but the mechanism depends strictly on the currency. If a sovereign nation issues debt in its own fiat currency (e.g., the U.S. borrowing in USD or Japan in JPY), a nominal default is a political choice, not an economic inevitability, because the central bank can always print more money to pay the debt (though this risks hyperinflation). However, if a nation issues debt in a foreign currency (e.g., Argentina borrowing in USD), it cannot print USD. If it runs out of foreign reserves, it will suffer a hard sovereign default, devastating bondholders.
Q: Why would anyone buy a government bond when corporate bonds offer higher interest rates?
Investors buy government bonds primarily for capital preservation, non-correlation to equities, and extreme liquidity, not for maximum yield. During a severe economic depression, companies go bankrupt, causing corporate bonds to default or crash in value alongside the stock market. Government bonds, specifically long-duration Treasuries, tend to have negative correlation with equities during panics, meaning they rise in value when everything else crashes, providing critical portfolio stability.
Q: What happens to corporate bond prices if the company gets a credit downgrade?
If an agency downgrades a corporation (e.g., from BBB to BB), the market mathematically requires a higher yield to compensate for the newly identified risk. Because the bond's coupon is fixed, the only way the yield can increase is if the bond's price falls on the secondary market. Downgrades from Investment Grade to High Yield (creating so-called "Fallen Angels") are particularly brutal, as many institutional funds are legally mandated to sell Junk bonds, creating a cascade of forced selling that crushes the bond's price.
Q: How does the "Z-Spread" differ from a normal yield spread?
A standard yield spread simply compares the overall yield of a corporate bond to a government bond of the exact same maturity. The Zero-Volatility Spread (Z-Spread) is much more advanced. It measures the constant spread that must be added to the entire government spot-rate yield curve in order to make the present value of the corporate bond's cash flows equal its current market price. It accounts for the entire shape of the yield curve rather than a single point, providing institutional investors with a much more accurate measure of credit risk.
Q: Are corporate bond dividends treated as ordinary income or capital gains?
First, bonds pay interest (coupons), not dividends. In most jurisdictions, including the United States, the periodic coupon interest payments received from a corporate bond are taxed as ordinary income at your highest marginal tax rate. Capital gains taxes only apply if you buy the bond at a discount on the secondary market and sell it later at a higher price (or hold it to par at maturity). This high tax burden on ordinary income is why high-net-worth investors often prefer municipal bonds over corporate bonds in non-sheltered accounts.
See also
- Loading related topics...