How Mutual Funds Work
1. The Core Mechanics of Pooled Investments
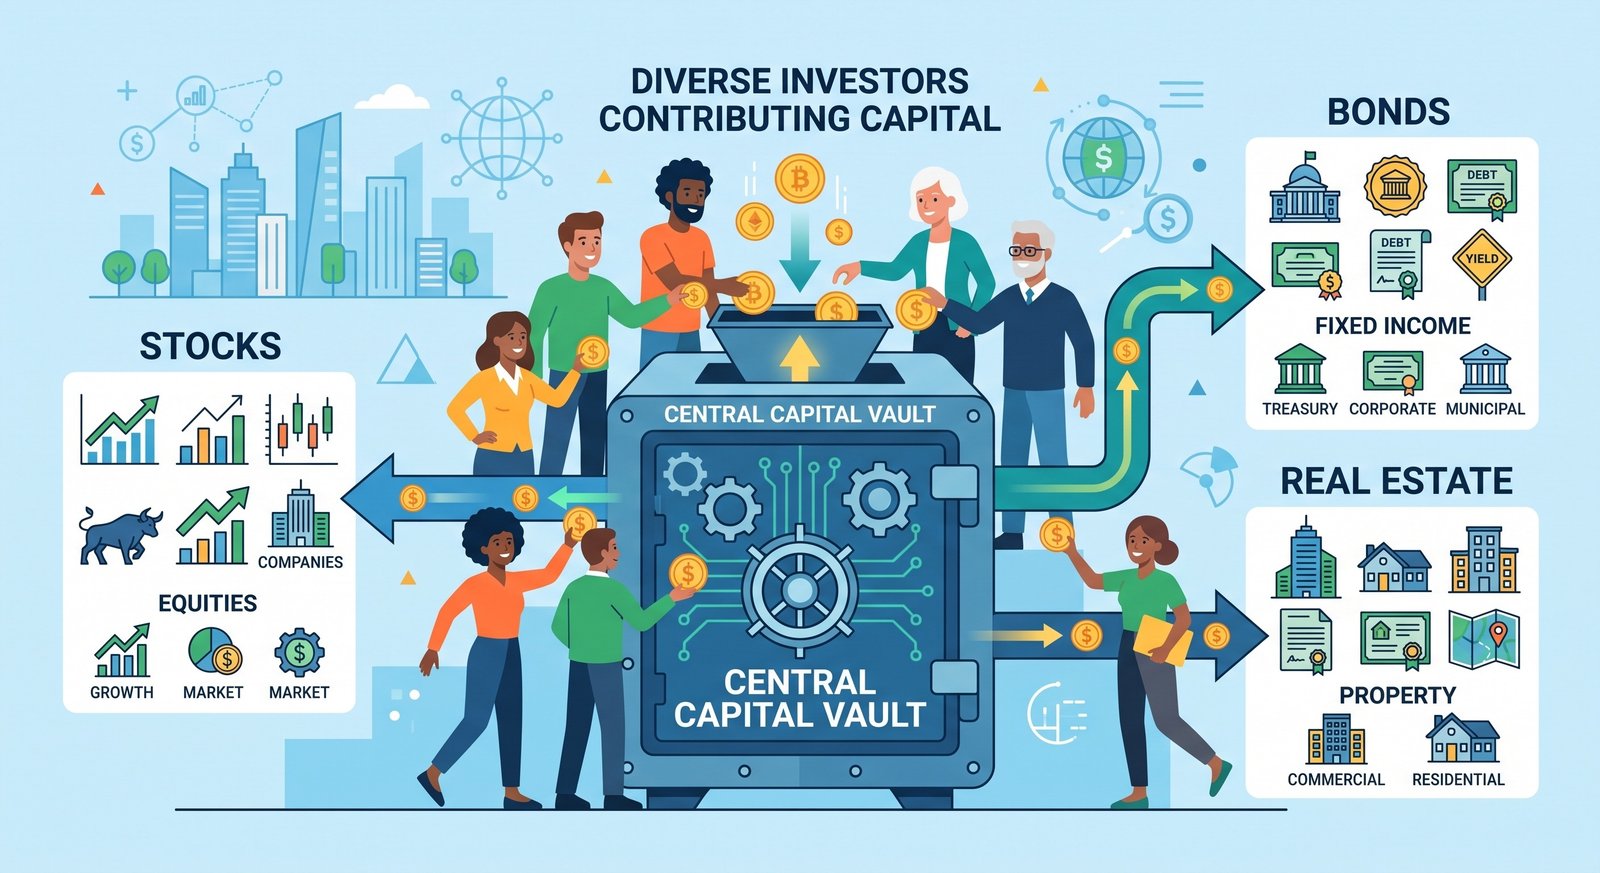
At its most fundamental level, a mutual fund is a financial vehicle composed of a pool of money collected from many investors to invest in securities like stocks, bonds, money market instruments, and other assets. Mutual funds are operated by professional money managers, who allocate the fund's assets and attempt to produce capital gains or income for the fund's investors. A mutual fund's portfolio is structured and maintained to match the investment objectives stated in its prospectus.
The inception of mutual funds solved a critical macroeconomic problem: barrier to entry. Historically, building a properly diversified portfolio of individual stocks and corporate bonds required substantial capital and institutional-level research. By aggregating the capital of thousands of retail investors, mutual funds unlock economies of scale. This pooling allows a person investing $500 to achieve the same exact diversification, fractional ownership, and professional management as someone investing $5,000,000.
The operational structure of a mutual fund is strictly regulated to protect investors. It typically involves a Sponsor (who initiates the fund), a Trust and Board of Trustees (who hold the underlying assets and protect investor interests), an Asset Management Company or AMC (the fund managers who make the trading decisions), and a Custodian (an independent bank that physically holds the securities). This segregation of duties ensures that the AMC cannot simply abscond with the investors' money.
2. Deep-Dive: Mathematical Formulas Governing Mutual Funds
To truly understand mutual funds, one must understand the quantitative mechanics that drive them. Unlike stocks, which are priced based on the real-time supply and demand of the secondary market throughout the trading day, a traditional mutual fund is priced just once per day, at the close of the market. This pricing relies on a specific mathematical calculation known as the Net Asset Value (NAV).
- Net Asset Value (NAV): The NAV represents a fund's per-share market value. The formula is: NAV = (Total Market Value of Assets - Total Liabilities) / Total Number of Outstanding Shares. For example, if a fund holds $100 million in securities, has $5 million in liabilities (unpaid operational costs), and 5 million shares issued to investors, the NAV is ($100M - $5M) / 5M = $19.00 per share.
- Total Expense Ratio (TER): This measures the total cost of operating the fund as a percentage of its assets. TER = Total Fund Costs / Total Fund Assets. If a fund charges 1.5% annually, a $10,000 investment will cost $150 per year in fees, which is deducted automatically from the NAV on a daily fractional basis. Over decades, compounding makes the TER one of the most vital metrics to evaluate.
- Tracking Error (Index Funds): For passive funds, the goal is not to beat the market, but to perfectly mimic a benchmark index. Tracking Error is the annualized standard deviation of the difference in returns between the fund and its target index. A lower tracking error indicates a more efficient, tightly managed fund.
3. Case Study 1: The Accumulation Phase and Dollar-Cost Averaging
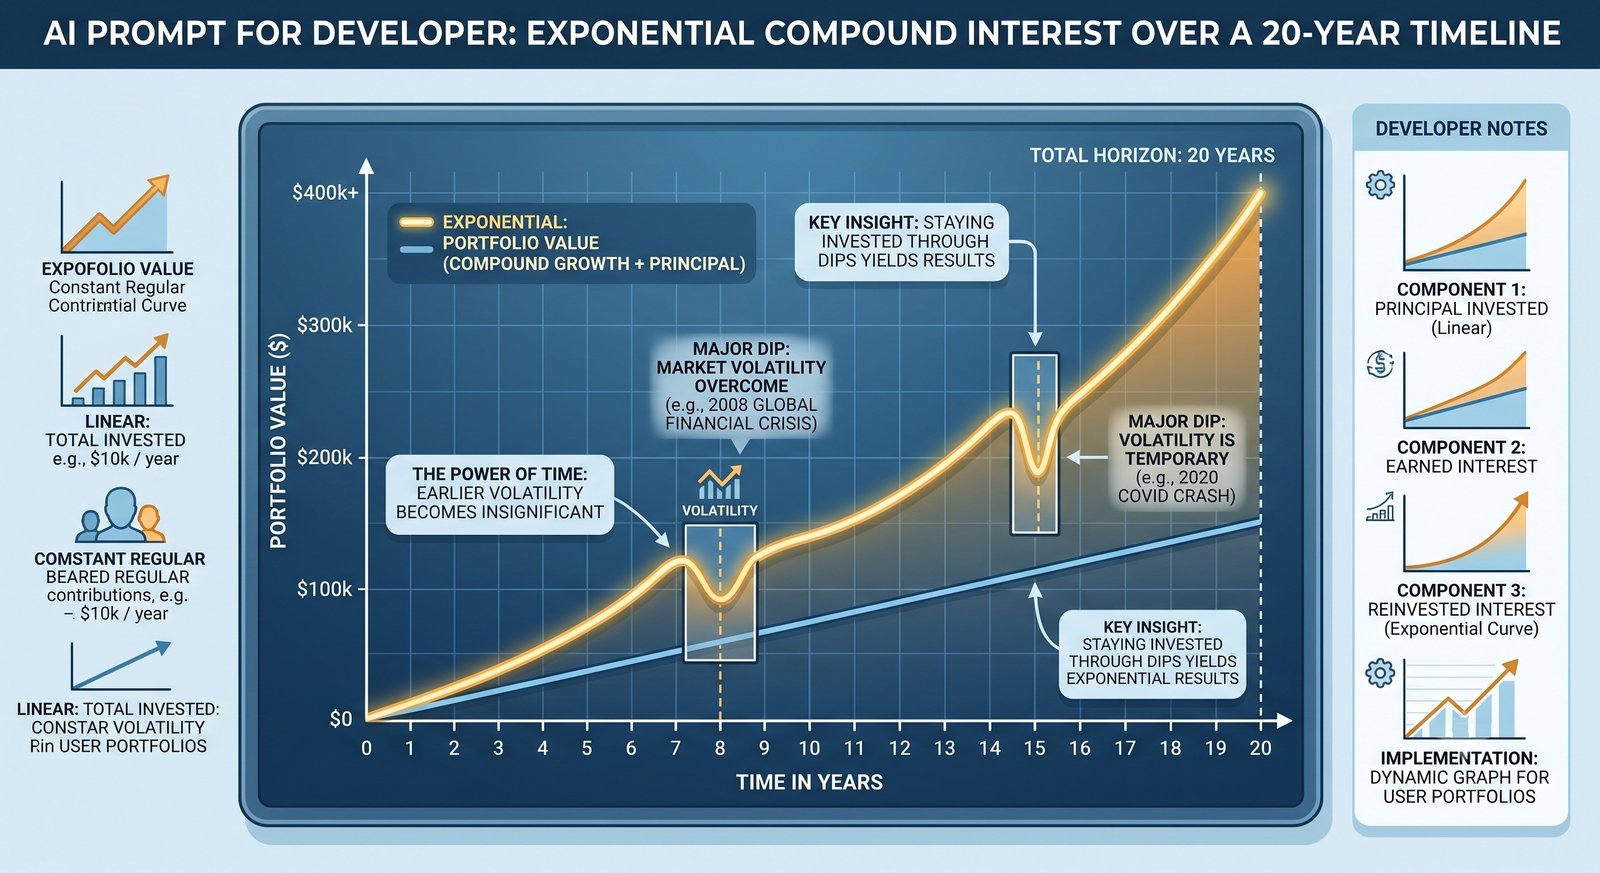
To illustrate how the mechanics of mutual funds generate wealth over time, let us examine a highly realistic scenario involving systematic investing—often referred to as Dollar-Cost Averaging (DCA) or a Systematic Investment Plan (SIP).
Scenario: Julian, a 30-year-old software developer, decides to invest $600 at the start of every month into a Broad Market Equity Index Fund. The fund tracks the performance of the top 500 companies in the market and has an incredibly low Total Expense Ratio of 0.05%.
Over a 20-year period, Julian experiences two major market recessions where the fund's NAV drops by over 30%. However, because Julian is investing a fixed dollar amount every single month, his $600 buys more shares when the NAV is low, and fewer shares when the NAV is high. This mathematical reality automatically lowers his average cost per share over time.
The Outcome: After 240 months (20 years), Julian has invested out-of-pocket exactly $144,000. Assuming a realistic annualized return (CAGR) of 8% net of fees, his final portfolio value is approximately $353,000. The underlying engine here is not market timing, but rather the continuous accumulation of fund units, augmented by the compounding of reinvested dividends across thousands of underlying companies. Julian's wealth was created purely through the fund's structure handling the complexity of diversification and dividend reinvestment on his behalf.
4. Types of Funds & Asset Allocation Table
Not all mutual funds hold stocks. The overarching term encompasses a vast array of asset classes tailored for different risk appetites, horizons, and macroeconomic environments. An investor's success is largely determined by their macro asset allocation among these fund categories rather than their specific fund selection.
| Fund Category | Primary Assets Held | Risk / Time Horizon |
|---|---|---|
| Equity Funds (Active & Index) | Shares of publicly traded companies (Large, Mid, Small Cap). | High Risk / Long Term (7+ Years) |
| Debt / Fixed-Income Funds | Government bonds, Treasury bills, corporate debentures. | Low-Medium Risk / Short to Medium Term (1-5 Years) |
| Hybrid / Balanced Funds | A predetermined mix of both equities (e.g., 65%) and debt (e.g., 35%). | Medium Risk / Medium Term (3-7 Years) |
| Liquid / Money Market Funds | Extremely short-term debt instruments (maturity up to 91 days). | Very Low Risk / Ultra Short Term (Days to Months) |
5. Case Study 2: Wealth Preservation and Systematic Withdrawals
While accumulation is the focus for younger investors, wealth preservation and income generation define the retirement phase. A Systematic Withdrawal Plan (SWP) is a strategy where an investor withdraws a fixed amount from their mutual fund on a regular basis. This case study demonstrates how an SWP operates against the concept of "Sequence of Returns Risk."
Scenario: Maria, aged 65, retires with a portfolio of $800,000 consolidated into a Conservative Hybrid Mutual Fund. Her goal is to withdraw $4,000 per month ($48,000 annually) to cover her living expenses, which represents a 6% withdrawal rate.
In Year 1, the market performs poorly, and her fund's NAV drops by 8%. Because Maria is withdrawing a fixed $4,000, she is forced to sell more mutual fund units at lower prices to meet her cash requirement. This is the danger of an aggressive SWP in a down market. To combat this edge case, Maria had prudently kept two years' worth of expenses ($96,000) in a highly secure Liquid Mutual Fund. By pausing her SWP from the equity-heavy Hybrid fund and drawing from the Liquid fund during the bear market, she allows her main portfolio to recover without realizing massive losses. When the market recovers in Year 3, yielding 12%, she resumes her SWP, preserving her capital base for decades. This demonstrates the critical interplay between different mutual fund categories.
6. Edge Cases and Macro-Market Anomalies

Understanding mutual funds requires looking past standard market conditions to acknowledge edge cases. One prominent anomaly is the Liquidity Crisis within Debt Funds. If macroeconomic panic triggers mass redemptions (investors selling out all at once), a fund manager might be forced to sell off the most liquid, high-quality bonds in their portfolio first. This leaves the remaining investors holding a portfolio overly concentrated in illiquid, lower-quality commercial paper. Regulatory bodies have instituted "gating" rules allowing funds to temporarily halt redemptions precisely to prevent this death spiral.
Another edge case is the Dividend Trap. Novice investors often buy funds purely for high historical dividend payouts. However, in mutual funds, paying out a dividend explicitly reduces the NAV by the exact amount paid. If a fund with an NAV of $100 declares a $5 dividend, the NAV instantly falls to $95 on the ex-dividend date. Without underlying asset growth, chasing high fund dividends is akin to taking your own money out of one pocket and putting it in another, often incurring unnecessary tax liabilities in the process.
7. Actionable Strategy Guide: How to Evaluate and Invest
Theoretical knowledge must be mapped to practical application. Follow this step-by-step strategy guide to initiate a robust mutual fund portfolio.
- Step 1: Quantify the Horizon: Any money needed within 0-3 years must be allocated strictly to Liquid or Short-Term Debt mutual funds to prevent capital erosion. Funds earmarked for 7+ years can be directed to Equity mutual funds.
- Step 2: Scrutinize the Expense Ratio: When selecting an equity fund, compare the TER. If choosing an active fund, ensure it is cheaper than its category peers. If choosing a passive index fund, look for a TER below 0.10%.
- Step 3: Analyze Rolling Returns, Not Trailing Returns: Ignore the 1-year or 5-year point-to-point returns heavily marketed in brochures. Look for 3-year or 5-year rolling returns to assess the fund manager's consistency across various market cycles.
- Step 4: Check Portfolio Turnover: A high portfolio turnover ratio (e.g., >80%) means the fund manager is trading stocks rapidly. This incurs high brokerage costs and potential capital gains taxes, which eat into your net returns. Seek funds with low turnover unless the mandate explicitly calls for dynamic rebalancing.
- Step 5: Automate the Process: Emotion is the enemy of wealth creation. Set up an automated monthly draft (SIP) directly from your checking account into the chosen funds. Automation enforces discipline during both market euphoria and market despair.
8. Frequently Asked Questions (FAQ)
Q: What happens to my invested money if the Asset Management Company (AMC) goes bankrupt?
Your money is entirely safe. Structurally, the AMC is merely a service provider hired to make trading decisions. The actual securities (stocks and bonds) you own through the fund are held by an independent third-party Custodian, under the oversight of a Board of Trustees. If the AMC goes bankrupt, the Trustees will simply appoint a new AMC to manage the fund, or liquidate the assets and return the current market value directly to the investors.
Q: How does a mutual fund differ fundamentally from an Exchange-Traded Fund (ETF)?
While both pool money to buy a basket of securities, the mechanics of trading them differ drastically. Mutual funds are priced only once per day at the closing NAV, and you buy or sell directly with the fund itself. ETFs trade on a stock exchange like individual stocks, meaning their price fluctuates by the second based on market demand, and you buy/sell them from other investors on the secondary market rather than directly from the fund issuer.
Q: Can I lose more money than I initially invested in a mutual fund?
No. Unlike trading on margin, utilizing futures, or short-selling individual equities where losses can theoretically exceed your principal, a mutual fund is a cash-based asset. The absolute maximum you can lose is 100% of your investment (if the NAV drops to zero), but you will never owe money or be placed in a negative equity position.
Q: What is 'Growth' versus 'IDCW' (Income Distribution cum Capital Withdrawal) in mutual fund plans?
In a Growth plan, any dividends or interest earned by the fund's underlying assets are automatically reinvested back into the fund, accelerating compound growth. In an IDCW (formerly known as a Dividend plan), those earnings are periodically paid out to you as cash into your bank account. For long-term wealth creation, Growth is almost mathematically superior due to the absence of dividend taxation leakage and the raw power of uninhibited compounding.
See also
- Loading related topics...