Introduction to Bonds
The Definitive Guide to Fixed-Income Securities, Yield Mechanics, and Portfolio Strategies
The global financial system is built upon twin pillars: equity and debt. While equities (stocks) capture the public imagination with their volatility and potential for exponential growth, it is the debt market—specifically the global bond market—that acts as the underlying architecture of modern capitalism. With a total global outstanding value far exceeding that of the global stock market, bonds dictate sovereign spending, corporate expansion, and the fundamental cost of capital worldwide.
At its most foundational level, a bond is a securitized IOU. It is a legally binding contract in which an investor (the creditor) loans money to an entity (the issuer/borrower), typically a corporation, municipality, or national government. In return, the issuer promises to pay back the original loan amount on a specific date, while also making periodic, fixed interest payments over the life of the loan. Understanding bonds requires a mastery of macroeconomic forces, intricate mathematical valuations, and a deep appreciation for risk assessment.
1. The Historical Evolution of Bond Markets
The concept of yielding debt predates coined currency, with evidence of grain loans in ancient Mesopotamia. However, the true modern bond market finds its roots in the medieval and Renaissance periods. The prestiti of Venice (12th century) were forced loans levied on wealthy citizens by the state to fund wars. These loans paid a 5% interest rate and, crucially, were securitized—meaning they could be bought and sold among citizens, creating the first secondary market for sovereign debt.
In the 17th century, the Bank of England revolutionized sovereign debt by issuing perpetual bonds (Consols) to fund conflicts against France. These instruments paid interest forever without a maturity date. By the 19th and 20th centuries, the railroad boom in the United States birthed the corporate bond market, allowing private enterprises to raise massive capital without diluting ownership. Today, the bond market is a highly digitized, mathematically rigorous environment dominated by institutional players, central banks, and algorithmic trading, deeply integrated into global monetary policy.
2. Anatomy and Core Terminology of a Bond
To navigate the fixed-income landscape, one must first understand the structural components that legally and financially define every bond.
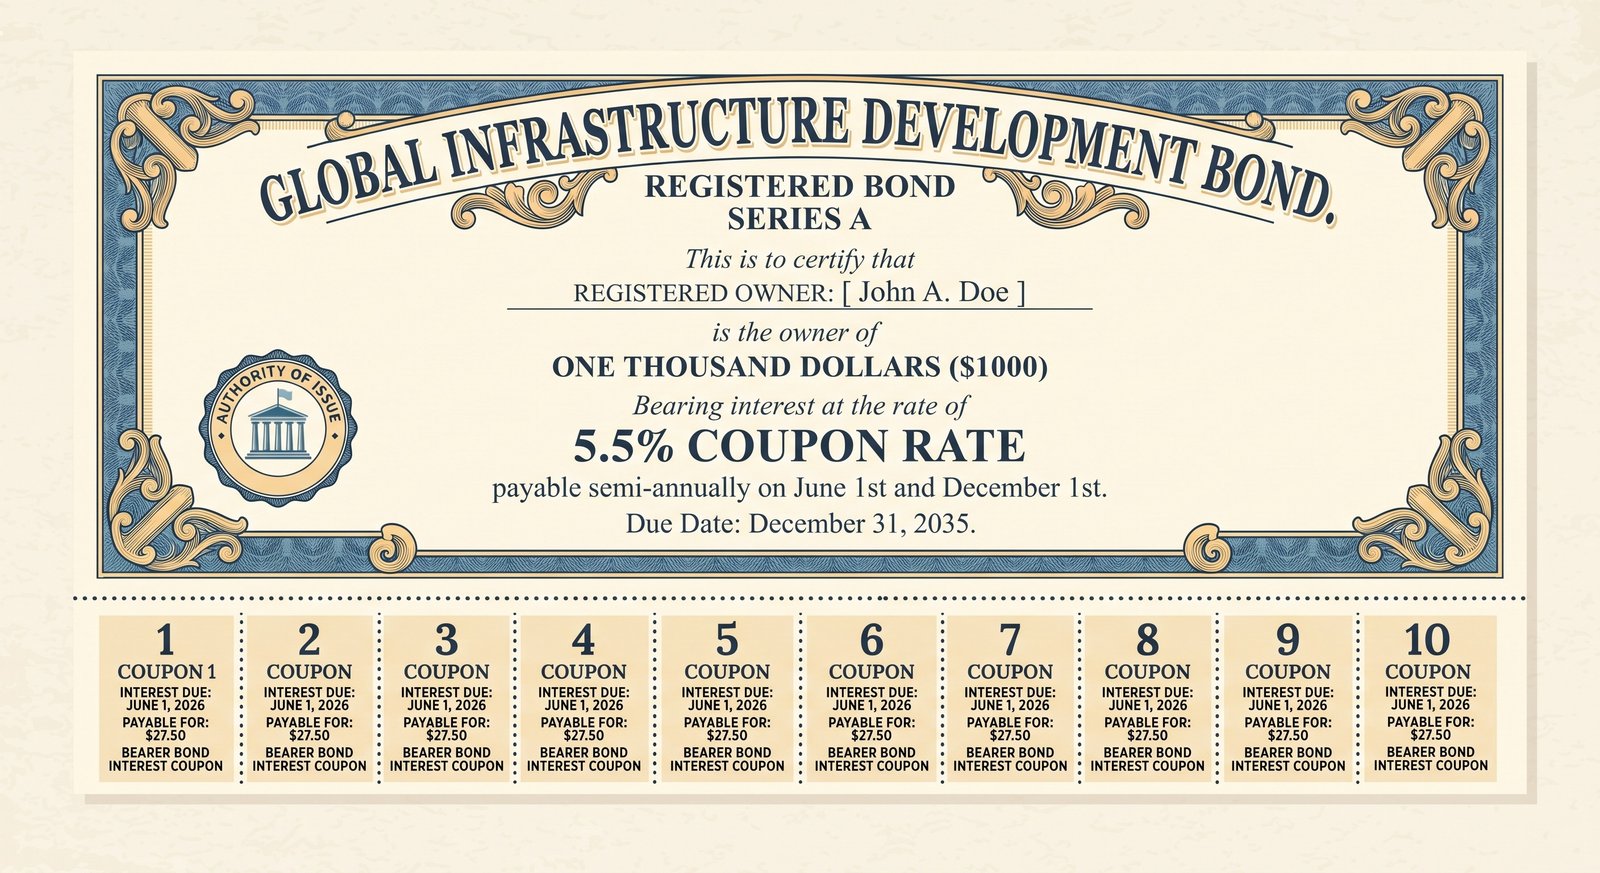
- Face Value (Par Value / Principal): The original amount of money borrowed by the issuer, and the exact amount that will be repaid to the investor at maturity. Standard face values are typically $1,000 for corporate bonds. Prices are quoted as a percentage of par (e.g., a quote of "98" means the bond trades at $980).
- Coupon Rate: The annual interest rate paid by the bond's issuer relative to the bond's face value. For example, a $1,000 bond with a 5% coupon rate pays $50 annually (usually distributed as two $25 semi-annual payments). This rate is generally fixed for the life of the bond.
- Maturity Date: The exact date on which the issuer must return the face value to the bondholder, terminating the debt contract. Bonds are categorized by maturity into short-term (bills/paper, under 1 year), medium-term (notes, 1 to 10 years), and long-term (bonds, 10 to 30+ years).
- Covenants: Legally binding clauses written into the bond indenture (the contract). Positive covenants require the issuer to maintain certain financial ratios, while negative covenants restrict the issuer from taking actions—like taking on excessive additional senior debt or paying out massive shareholder dividends—that would jeopardize the bondholders' capital.
- Credit Rating: An assessment of the issuer's creditworthiness and probability of default, provided by agencies like Standard & Poor's (S&P), Moody's, and Fitch. "Investment Grade" bonds (rated AAA down to BBB-) are considered safe. Bonds rated BB+ and below are "High Yield" or "Junk" bonds, offering higher coupons to compensate for elevated default risk.
3. Macroeconomic Mechanics: Interest Rates and the Yield Curve
The most fundamental rule of fixed-income investing is the inverse relationship between bond prices and interest rates. When central banks (like the U.S. Federal Reserve or the European Central Bank) raise baseline interest rates to combat inflation, newly issued bonds must offer higher coupon rates to attract investors. Consequently, older bonds with lower coupon rates become less attractive, and their prices must fall on the secondary market until their effective yield matches the new, higher market standard.
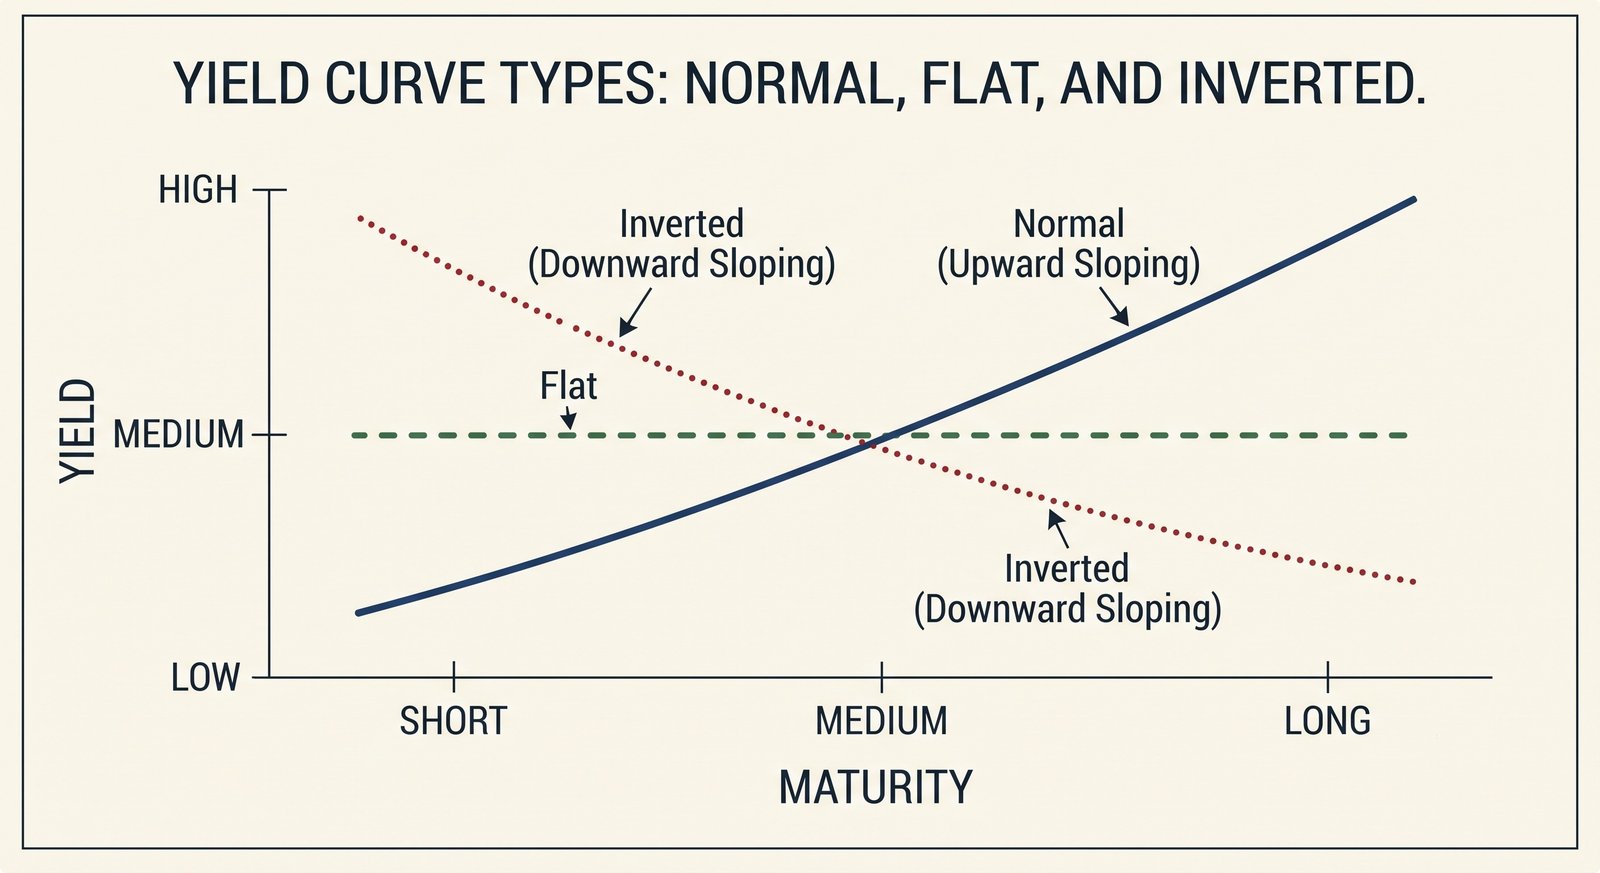
The Yield Curve: This macroeconomic indicator plots the yields of similar-quality bonds against their varying maturities (e.g., U.S. Treasuries from 1 month to 30 years). It is a profound predictor of economic health.
- Normal Yield Curve: Slopes upward. Investors demand higher yields for locking up their money for longer periods due to inflation, liquidity constraints, and uncertainty risks. This indicates healthy economic expansion.
- Flat Yield Curve: Short-term and long-term yields are nearly identical. This typically indicates a transition period in the economy, often signaling that a tightening cycle by the central bank is nearing its end.
- Inverted Yield Curve: Slopes downward (short-term yields are higher than long-term yields). This is a severe macroeconomic anomaly indicating that investors expect central banks to aggressively cut rates in the future to combat an impending recession. It is historically one of the most accurate leading indicators of economic contractions.
4. Deep-Dive Explanations & Mathematical Formulas
The valuation of a bond is rooted in the time value of money. Because a bond produces a predictable stream of future cash flows, its intrinsic value today is simply the present value of all those future cash flows, discounted by the current market interest rate.
1. Bond Pricing Formula: The theoretical fair price (P) of a bond is calculated using the following Present Value equation:
P = ∑t=1n [ C / (1+r)t ] + [ F / (1+r)n ]
Where:
- P: Current market price of the bond.
- C: Periodic coupon payment (cash flow).
- r: Market discount rate / Yield to Maturity per period.
- n: Total number of payment periods until maturity.
- F: Face value (principal) paid at maturity.
2. Yield Metrics: Yield is the cornerstone of bond analysis, representing the return an investor achieves. There are multiple ways to calculate it.
- Current Yield: A simple snapshot metric. Calculated as C / P. If a bond pays $50 a year and is currently trading at $900, its current yield is 5.55%. It ignores capital gains/losses at maturity.
- Yield to Maturity (YTM): The total anticipated annualized return if the bond is held until it matures. YTM equates the present value of a bond's cash flows to its current market price. It implies two strict mathematical assumptions: the bond is held to maturity, and all coupons are reinvested at the exact YTM rate.
3. Measuring Interest Rate Risk (Duration): Investors must quantify exactly how much a bond's price will change if interest rates move. This is measured by Duration.
Macaulay Duration calculates the weighted average time it takes to receive the bond's cash flows, expressed in years:
Dmac = [ ∑t=1n [ (t · C) / (1+y)t ] + [ (n · F) / (1+y)n ] ] / P
To convert this time measure into price sensitivity, we calculate Modified Duration:
Dmod = Dmac / [ 1 + (y / k) ]
(Where y is the yield to maturity and k is the number of compounding periods per year). The fundamental rule of thumb: If a bond has a Modified Duration of 7, a 1% increase in prevailing interest rates will cause the bond's price to drop by approximately 7%.
5. Realistic Case Studies
Applying fixed-income theory to real-world mechanics reveals the hidden risks and opportunities inherent in bond investing.
Case Study 1: Elena's Duration Dilemma (Interest Rate Risk)
Elena is a retiree seeking safe, stable income. In an environment where the Central Bank interest rate is 1.0%, she purchases $100,000 face value of newly issued 30-Year U.S. Treasury bonds carrying a coupon rate of 2.5%. She buys them at exactly "par" (100 cents on the dollar, paying $100,000).
Six months later, inflation surges unexpectedly to 6%. The Central Bank reacts aggressively, raising interest rates to 4.5% over the next year. New 30-Year Treasuries are now being issued with 5.0% coupons. Elena suddenly needs to liquidate her position to pay for an emergency medical expense. She checks the secondary market value of her bonds.
Because her bond has a high Modified Duration (approximately 19 years due to its long maturity and low coupon), its price has plummeted. No investor will pay $100,000 for a bond yielding 2.5% when they can buy a new one yielding 5.0%. To make her bond's yield competitive, the price on the secondary market drops to roughly $62,000. If Elena sells, she realizes a massive $38,000 capital loss on a supposedly "risk-free" government bond. This illustrates that while government bonds have zero default risk, they carry immense interest rate risk if sold before maturity.
Case Study 2: Marcus and the High-Yield Mirage (Default & Recovery Risk)
Marcus, an aggressive investor, wants high returns. He bypasses investment-grade bonds and purchases $50,000 worth of Senior Unsecured Notes from "AeroTech," an airline startup. The bonds carry a highly attractive 9.5% coupon and are rated B- (Junk).
Three years into the 10-year bond, a global macroeconomic shock grounds all flights. AeroTech files for Chapter 11 bankruptcy restructuring. Marcus stops receiving his $4,750 annual coupon payments immediately.
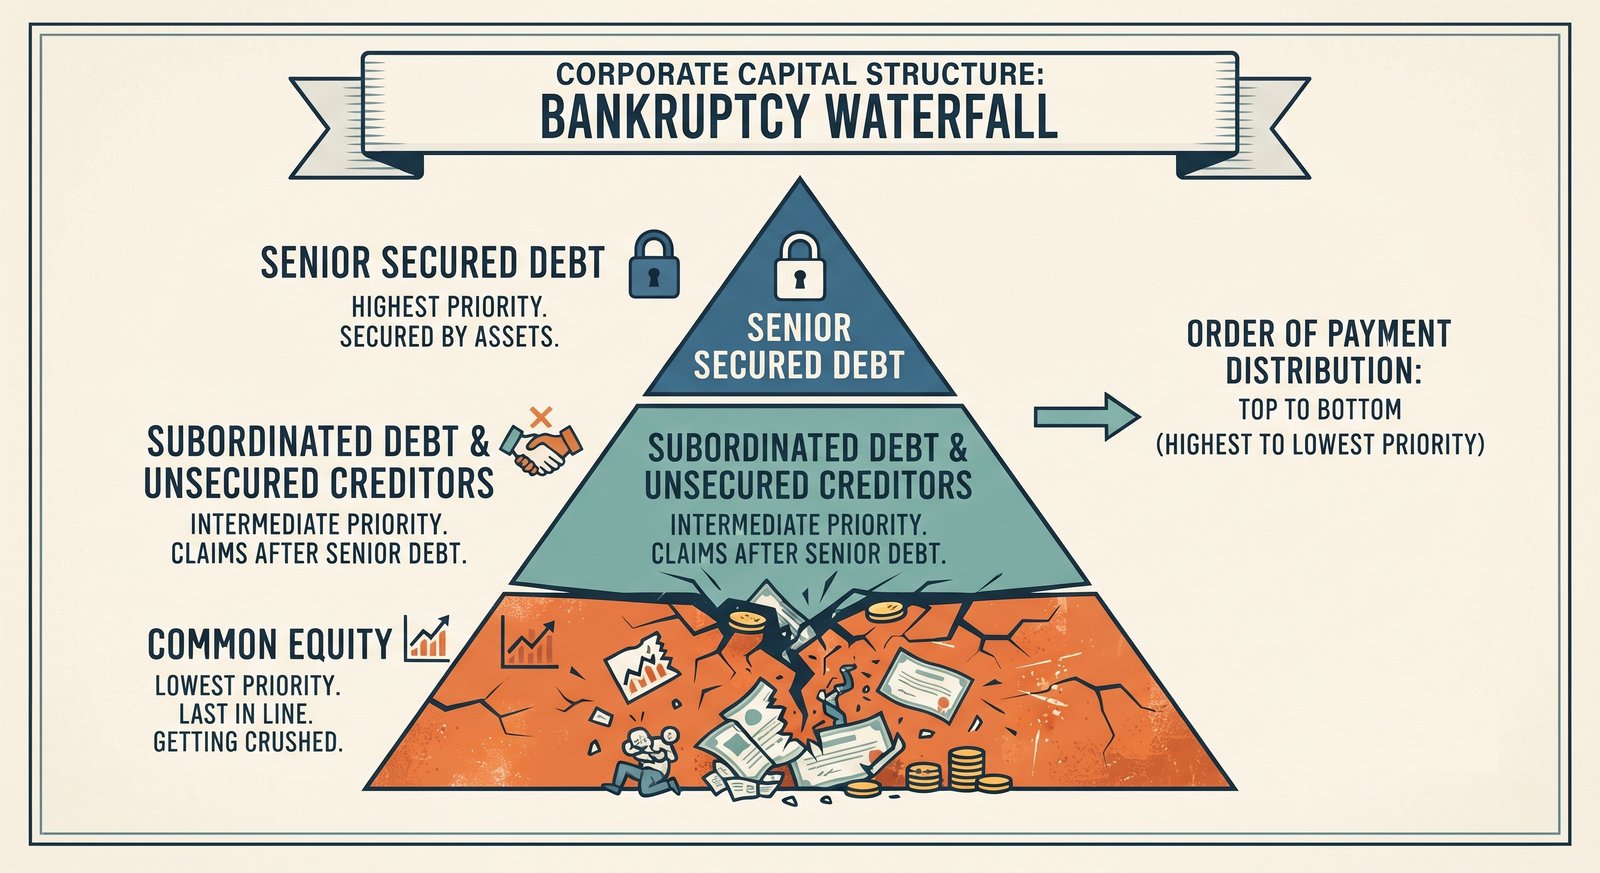
During bankruptcy, the Capital Structure dictates who gets paid from the liquidation of assets. Senior Secured Debt holders (banks who lent against physical airplanes) are paid first and recover 90% of their money. Marcus holds Senior Unsecured debt. He ranks lower. Once the secured lenders are paid, the remaining assets are liquidated. Marcus receives a "recovery rate" of 35 cents on the dollar. He gets back $17,500 of his $50,000 principal. Meanwhile, the equity stockholders of AeroTech are wiped out entirely (0 recovery). This case demonstrates both the dangers of default in high-yield debt and the structural protection bonds offer over equities in a worst-case scenario.
6. Structured Comparison Tables
To optimize asset allocation, investors must understand how bonds contrast with other asset classes, and how sub-categories within the bond market differ from one another.
| Feature / Metric | Bonds (Fixed Income) | Equities (Stocks) |
|---|---|---|
| Position of Investor | Lender / Creditor | Owner / Shareholder |
| Income Stream | Highly predictable fixed coupon payments (legally binding). | Variable dividends (at the discretion of the Board of Directors). |
| Capital Appreciation | Limited. Price pulls toward Par Value as maturity approaches. | Theoretically unlimited upside potential based on corporate growth. |
| Priority in Bankruptcy | High Priority (Seniority based on secured/unsecured status). | Lowest Priority (Residual claim, often wiped out completely). |
Within the bond market itself, the issuer defines the risk profile and taxation rules.
| Bond Category | Primary Issuer | Default Risk & Tax Features |
|---|---|---|
| Sovereign / Treasuries | National Governments (e.g., U.S., Germany, Japan) | Virtually zero default risk (can print money). Interest is usually subject to federal tax, but exempt from state/local taxes. |
| Corporate Bonds | Publicly or Privately held Companies | Variable risk (AAA to Junk). Higher yields. Interest is fully taxable at all government levels. |
| Municipal Bonds (Munis) | States, Cities, Counties, Utilities | Very low default risk. Interest is often "Triple-Tax-Free" (Exempt from Federal, State, and Local taxes if the investor lives in the issuing state). |
7. Advanced Edge-Cases and Structural Variations
Standard "bullet" bonds (fixed coupon, single maturity date) are merely the foundation. Advanced fixed-income structures involve embedded options and inflation hedges that fundamentally alter their behavior.
- Zero-Coupon Bonds: These bonds do not make periodic interest payments. Instead, they are sold at a deep discount to face value and mature at par (e.g., buying a $1,000 bond for $650 today). The profit is the difference between the purchase price and maturity value. Edge Case Warning: In many jurisdictions, investors are subject to "Phantom Income" tax, meaning they must pay annual taxes on the imputed interest that accrues each year, even though they receive no actual cash until maturity.
- Callable Bonds: The issuer embeds a "call option," giving them the right to redeem the bond and pay back the principal before the official maturity date. Issuers exercise this right when interest rates fall, allowing them to refinance their debt at lower rates. This creates massive Reinvestment Risk for the investor, who now receives their cash back in a low-yield environment and must reinvest at inferior rates.
- TIPS (Treasury Inflation-Protected Securities): A sovereign bond designed to hedge against Consumer Price Index (CPI) inflation. The coupon rate is fixed, but the principal value of the bond is adjusted bi-annually based on inflation rates. If inflation is high, the principal grows, and the fixed coupon percentage is calculated on a larger base, producing more cash. In a severe deflationary environment, the principal shrinks, but the U.S. government guarantees it will never pay out less than the original face value at maturity.
8. Actionable Strategy Guide: Constructing a Bond Ladder
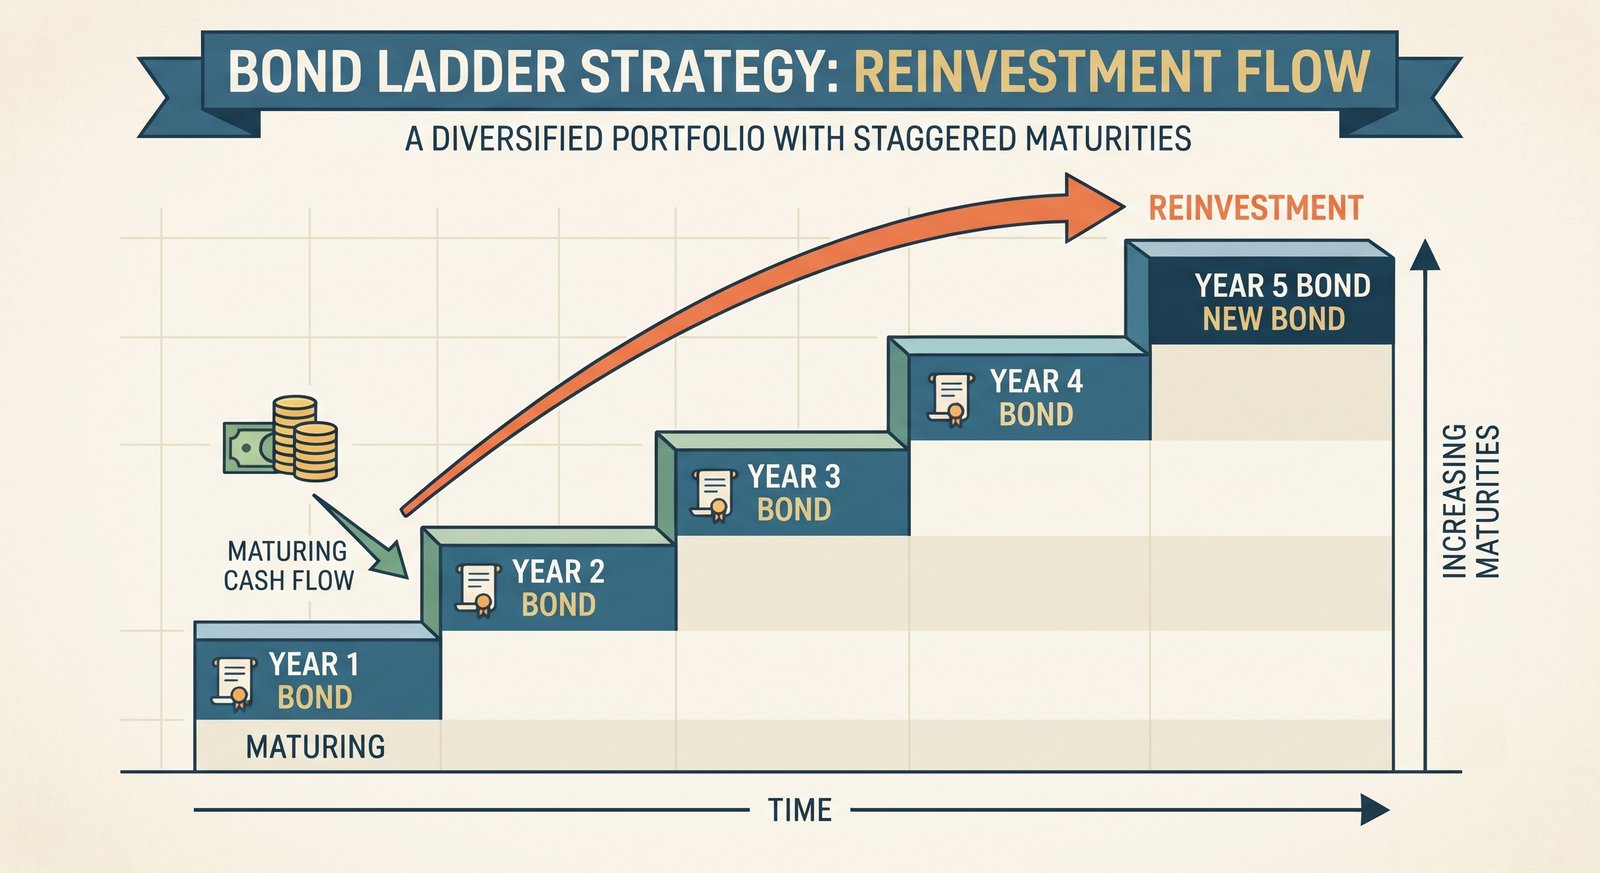
Attempting to predict interest rate movements (timing the market) is notoriously difficult. To mitigate interest rate risk, optimize yields, and ensure constant liquidity, professional fixed-income managers utilize a strategy known as Bond Laddering. Here is a step-by-step guide to building a 5-year ladder.
- Step 1: Divide Your Capital. Take your total fixed-income allocation (e.g., $50,000) and divide it equally across the number of rungs in your ladder. For a 5-year ladder, you will create five $10,000 tranches.
- Step 2: Purchase Staggered Maturities. Invest the first $10,000 in a bond maturing in 1 year. Invest the second $10,000 in a bond maturing in 2 years, and so forth, up to the 5-year bond. Ensure you are buying high-quality, non-callable bonds (like Treasuries or AAA corporates) to prevent the ladder from being broken by early redemption.
- Step 3: Collect Average Yields. Your portfolio now generates a blended yield. The shorter maturities provide immediate stability and liquidity, while the longer maturities boost your overall return.
- Step 4: Reinvest at Maturity. At the end of Year 1, your first bond matures, handing you $10,000 in cash. Take this cash and buy a new 5-Year bond (extending your ladder to replace the matured rung). By continuously doing this, you always have 20% of your portfolio maturing every single year.
- Step 5: Capitalize on Rate Changes. If interest rates are rising, you benefit because your maturing cash is constantly being reinvested into new, higher-yielding 5-year bonds. If rates are falling, you are protected because you locked in higher yields on your longer-duration rungs years ago.
9. Frequently Asked Questions (FAQs)
Q: What is the difference between buying individual bonds and buying a Bond ETF?
When you buy an individual bond and hold it to maturity, you are guaranteed to receive your principal back (assuming no default), regardless of interim interest rate fluctuations. A Bond Exchange-Traded Fund (ETF), however, holds a constantly rolling portfolio of bonds to maintain a specific target duration and technically never "matures." Therefore, Bond ETFs act more like equities; their Net Asset Value (NAV) fluctuates perpetually based on interest rates, and they do not offer a guaranteed return of principal on a specific date, making them highly susceptible to duration risk in a rising rate environment.
Q: How does inflation fundamentally destroy fixed-income value?
Inflation erodes the purchasing power of fiat currency over time. Because a standard bond pays a fixed fiat amount of money every year, and returns a fixed fiat principal at the end, rising inflation means those future cash flows will buy fewer goods and services. If you hold a bond yielding 3%, and the inflation rate rises to 5%, your "Real Yield" (nominal yield minus inflation) is -2%. You are mathematically losing purchasing power safely and predictably.
Q: Can I sell my bond before its maturity date?
Yes, bonds are traded daily on the secondary Over-The-Counter (OTC) market. However, you will sell it at the current market price, not its face value. If prevailing interest rates have risen since you bought the bond, you will likely have to sell it at a discount (realizing a capital loss). If rates have fallen, you can sell it at a premium (realizing a capital gain). Liquidity is also a vital factor; while Treasuries are highly liquid and trade easily, some municipal or obscure corporate bonds can be difficult to sell quickly without accepting a wide, disadvantageous bid-ask spread.
Q: What is the "Barbell Strategy" in bond investing?
Unlike a ladder, a Barbell Strategy concentrates investments at two extreme ends of the yield curve, completely ignoring medium-term bonds. Half the portfolio is invested in very short-term bonds (e.g., 6 months to 1 year) providing extreme liquidity and downside protection. The other half is invested in very long-term bonds (e.g., 20-30 years) to capture high yields. The short-end provides cash to quickly deploy if rates rise, while the long-end secures high income if rates stagnate or fall.
Q: Why do some corporate bonds occasionally yield less than government bonds in inverted curve environments?
Generally, corporate bonds always yield more than government bonds to compensate for credit risk. However, if the yield curve is severely inverted, a short-term 1-month Government Treasury Bill might yield 5.5%, while a high-quality 10-year Corporate Bond might yield 4.5%. The corporate bond isn't "safer"; rather, the duration premium is heavily skewed. The market is pricing in steep future rate cuts over the next decade, making long-term yields lower across the board, despite the corporate credit risk spread layered on top of the benchmark rate.
See also
- Loading related topics...