Market Capitalization
1. Introduction: The True Measure of Corporate Size
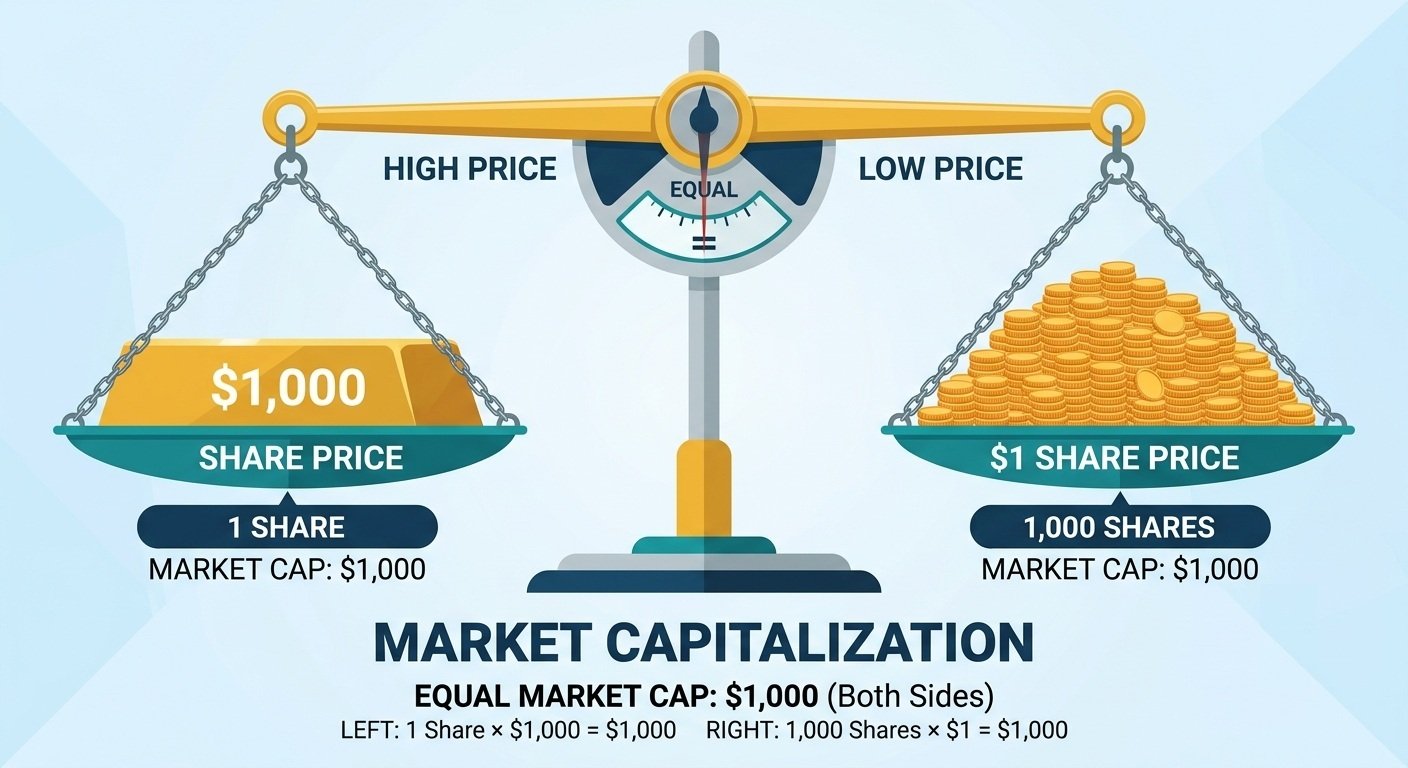
One of the most persistent and dangerous fallacies among novice retail investors is the belief that a company's stock price reflects its overall size or intrinsic value. A stock trading at $500 per share is frequently, and incorrectly, assumed to be a "larger" or "more expensive" enterprise than a stock trading at $10 per share. In the professional realm of corporate finance and institutional investing, the raw share price is a nearly meaningless metric on its own. The ultimate benchmark used to gauge the true scale, valuation, and macroeconomic weight of a publicly traded entity is its Market Capitalization (often abbreviated as "market cap").
Market capitalization represents the total dollar market value of a company's outstanding shares of stock. It is the theoretical price tag a buyer would have to pay to purchase the entire enterprise outright at the current open-market valuation. Understanding this concept is the gateway to sophisticated portfolio construction, index tracking, and risk management. Market cap dictates whether a company is considered a blue-chip stalwart capable of weathering severe economic depressions, or a highly volatile micro-cap susceptible to extreme price fluctuations and liquidity crunches.
2. Deep-Dive Explanations & Formulas: The Mechanics of Cap
The mathematics underlying market capitalization are refreshingly simple on the surface, but contain critical nuances that must be understood to prevent valuation errors. The baseline formula requires only two inputs: the current market price of a single share, and the total number of shares outstanding.
- The Primary Formula:
Market Capitalization = Current Market Price Per Share × Total Number of Outstanding Shares - Outstanding Shares vs. Authorized Shares: "Authorized shares" is the maximum number of shares a corporation is legally allowed to issue according to its corporate charter. "Outstanding shares" refers to the actual number of shares currently held by all shareholders, including institutional blocks, retail investors, and restricted shares held by company insiders. Market cap is always calculated using outstanding shares, never authorized shares.
- Fully Diluted Market Capitalization: Advanced fundamental analysts often calculate a separate, more conservative metric. A company may have millions of stock options, warrants, and convertible bonds that have not yet been turned into common stock. If exercised, these would flood the market with new shares. Fully Diluted Market Cap calculates the company's size assuming every single convertible instrument is exercised.
Formula: Fully Diluted Market Cap = Current Share Price × (Basic Outstanding Shares + All In-the-Money Options/Convertibles)
It is vital to understand that corporate actions such as stock splits do not alter a company's market capitalization. If a $100 billion company executes a 2-for-1 stock split, the share price is halved, but the number of outstanding shares doubles. The mathematical product (the market cap) remains exactly $100 billion. The slice of the pizza simply got cut into more, smaller pieces, but the total size of the pizza is unchanged.
3. The Market Capitalization Tiers: Defining Risk and Reward
The financial industry classifies publicly traded companies into specific tiers based on their market capitalization. These brackets are not strictly defined by law and can shift over time due to inflation and overall market expansion, but they serve as universally accepted benchmarks for asset allocation and risk profiling.
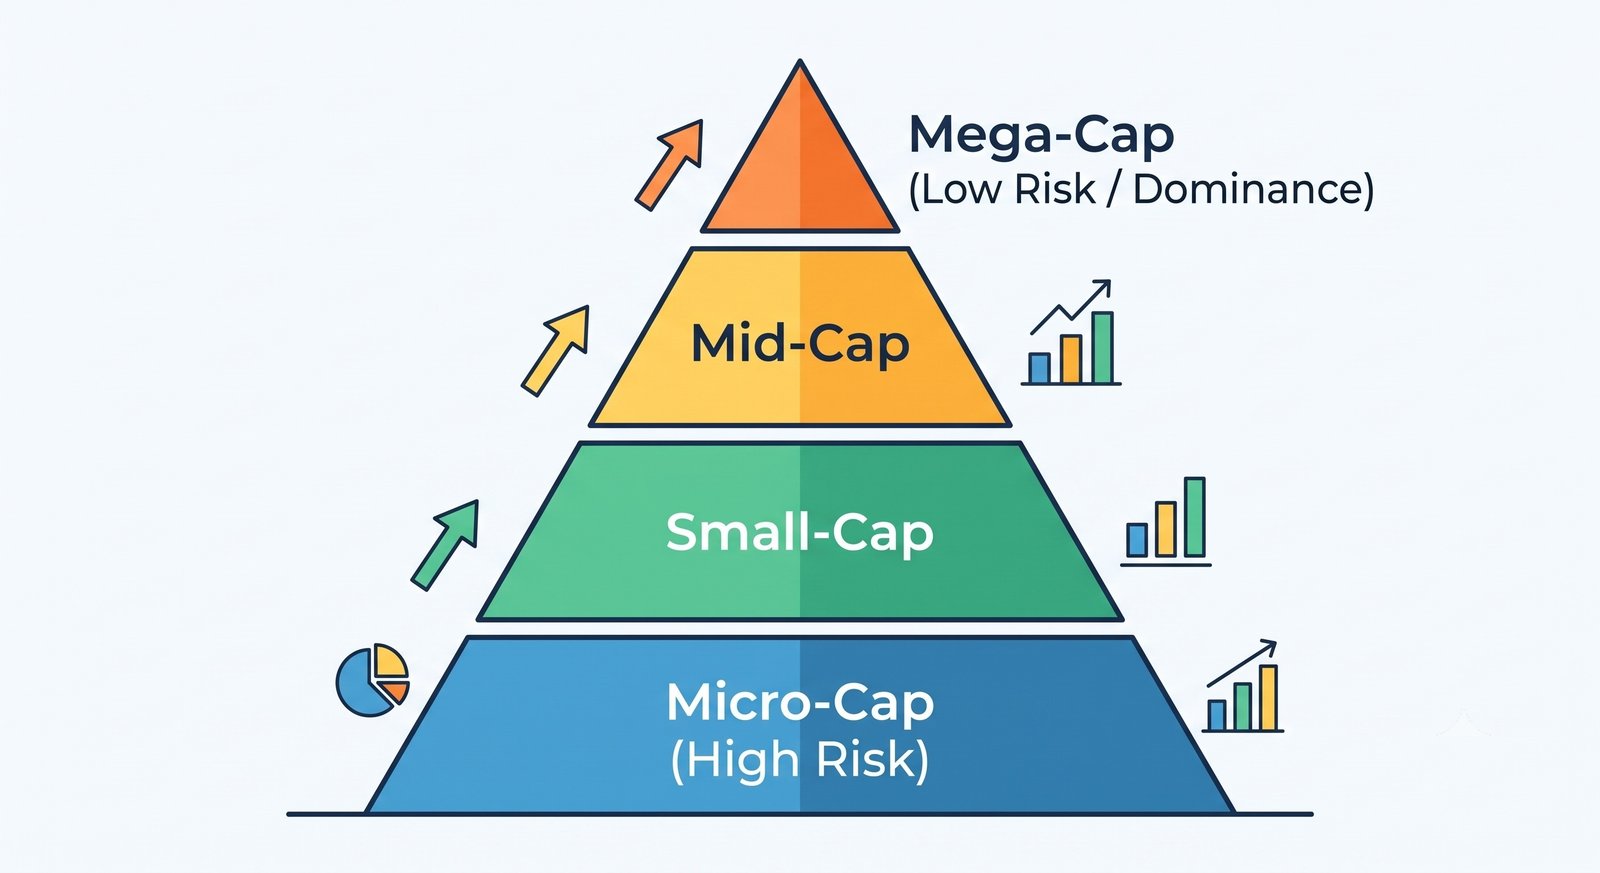
- Mega-Cap ($200 Billion and above): These are the absolute titans of industry (e.g., Apple, Microsoft, Saudi Aramco). They possess global reach, massive cash reserves, and deep economic moats. They offer the lowest volatility but generally slower growth, as moving the needle requires astronomical revenue increases.
- Large-Cap ($10 Billion to $200 Billion): Often referred to as "blue-chip" stocks, these companies make up the bulk of major indices like the S&P 500. They are characterized by stable business models, frequent dividend payouts, and high liquidity.
- Mid-Cap ($2 Billion to $10 Billion): These companies have established businesses and survived their startup phases but are still in a rapid expansion cycle. They offer a "sweet spot" for many investors, providing a blend of high growth potential without the extreme fragility of small-caps.
- Small-Cap ($300 Million to $2 Billion): Younger, heavily growth-oriented companies. They are highly sensitive to domestic economic shifts and interest rates because they often rely on debt to fund expansion. They offer massive upside potential but significant bankruptcy risk.
- Micro-Cap ($50 Million to $300 Million) & Nano-Cap (Below $50 Million): Highly speculative, illiquid "penny stocks." These trade with extreme volatility. Institutional investors generally ignore this tier due to low liquidity (buying or selling a position would violently crash or spike the share price).
4. Macroeconomic Mechanics: Capital Flows and the Business Cycle
An investor's understanding of market capitalization is incomplete without grasping how macroeconomic cycles drive capital flows between these tiers. The performance of small-cap stocks versus large-cap stocks is heavily dictated by Central Bank monetary policy and the overall business cycle.
During an expansionary phase (low interest rates, quantitative easing, high consumer confidence), capital tends to flow aggressively down the market-cap spectrum. Because borrowing costs are cheap, small-cap and mid-cap companies can easily finance aggressive growth. Investors, feeling optimistic and seeking higher returns, embrace the risk of small-caps, often causing indices like the Russell 2000 to drastically outperform the S&P 500.
Conversely, during a contractionary phase (rising interest rates, inflation, tightening liquidity), a "flight to safety" occurs. Small-cap companies, which often carry floating-rate debt and lack pricing power, face severe margin compression. Institutional capital aggressively rotates out of small-caps and into Mega-Cap and Large-Cap equities. These titans, armed with fortress balance sheets and pricing power, act as safe havens. Understanding this macroeconomic rotation allows astute investors to dynamically tilt their portfolios based on prevailing interest rate regimes.
5. Case Study 1: The Stock Price Illusion (Value vs. Price)
To illustrate why share price alone is a deceptive metric, consider two fictional companies operating in the retail sector: Aura Apparel and Vertex Outfitters.
An amateur investor notices that Aura Apparel is trading at $500 per share, while Vertex Outfitters is trading at only $10 per share. The novice wrongly concludes that Aura is a "massive, expensive" company and Vertex is a "small, cheap" bargain. However, a professional analyst looks at the outstanding shares to calculate the market capitalization.
Aura Apparel has purposefully kept its share count extremely low, with only 1 million shares outstanding. Therefore, its market capitalization is $500 million ($500 × 1,000,000). It is a Small-Cap company. Vertex Outfitters, on the other hand, executed multiple stock splits over decades to keep its share price accessible to retail investors. It has 5 billion shares outstanding. Its market capitalization is $50 billion ($10 × 5,000,000,000). Vertex is a Large-Cap behemoth, literally 100 times larger than Aura Apparel, despite trading at a fraction of the share price. Evaluating a company without calculating its market cap leads to fundamental misjudgments of risk and scale.
6. Case Study 2: Dilution and the Shrinking Slice of the Pie
Market capitalization is dynamic. It can grow either because the business becomes more valuable (driving the share price up) or because the company issues new shares (diluting existing investors). Let us look at BioSynth Pharmaceuticals, a mid-cap biotech firm.
BioSynth has a market cap of $2 Billion (100 million shares outstanding at $20 per share). An investor buys 1,000 shares for $20,000, owning 0.001% of the company. BioSynth announces it needs to raise cash for clinical trials and executes a secondary stock offering, printing 50 million brand new shares and selling them to institutions at $18 per share. The new total share count is 150 million.
The market cap of the company immediately jumps because of the cash injection, but the open market prices the shares down to $16 due to the dilution. The new market cap is $2.4 Billion (150 million × $16). The company itself is now "larger" by market cap metrics. However, our investor's 1,000 shares are now only worth $16,000, and their ownership stake has been diluted to 0.0006%. This case highlights a vital lesson: a growing market capitalization driven by share issuance destroys shareholder value, whereas a growing market capitalization driven by organic share price appreciation creates wealth.
7. Structured Comparison: The Core Market Cap Tiers
To optimize asset allocation, investors must understand the inherent trade-offs between different corporate sizes. The following table contrasts the three primary market cap tiers across crucial financial dimensions.
| Financial Metric / Trait | Large-Cap ($10B+) | Small-Cap ($300M - $2B) |
|---|---|---|
| Price Volatility (Beta) | Low. Tends to track the broader market closely. | Very High. Prone to double-digit percentage swings. |
| Long-Term Growth Potential | Moderate. Law of large numbers limits 10x growth. | Exponential. Capable of multi-bagger (10x+) returns. |
| Dividend Payout Likelihood | High. Excess cash is regularly returned to shareholders. | Low. Almost all capital is aggressively reinvested in R&D. |
| Macroeconomic Sensitivity | Resilient. Access to global markets and cheap debt. | Vulnerable. Heavily impacted by domestic interest rates. |
8. Free-Float Methodology: How Modern Indices Work
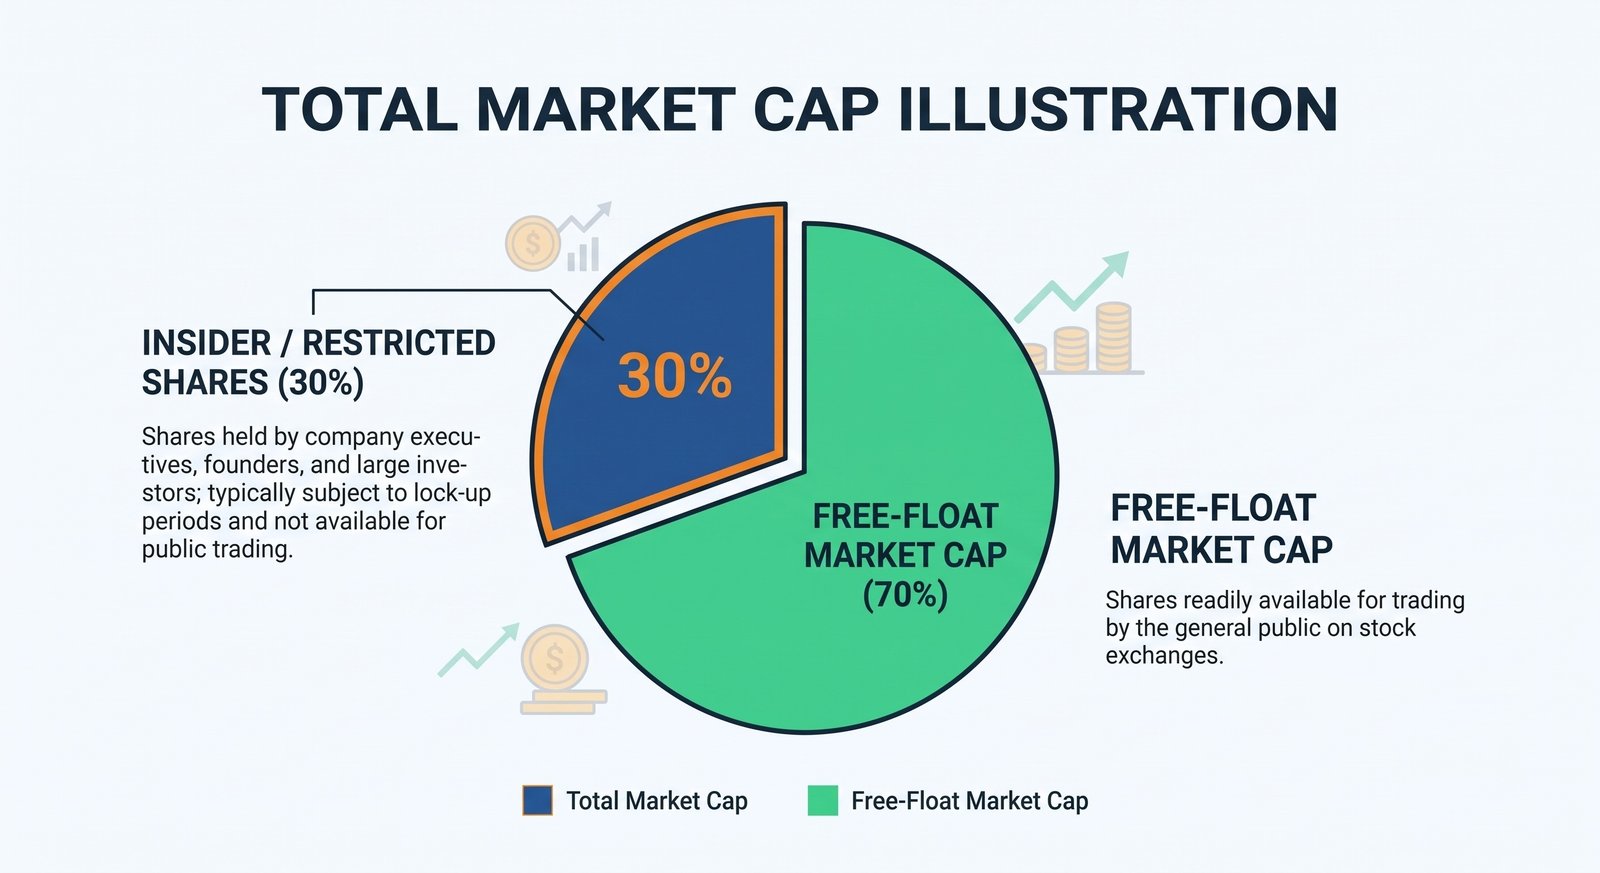
When discussing major market indices like the S&P 500 or the Nasdaq 100, we must differentiate between Total Market Capitalization and Free-Float Market Capitalization. Total market cap includes every single share in existence. However, in many companies (especially founder-led businesses or state-owned enterprises), a massive percentage of shares are tightly held by insiders, founding families, or governments, and are not available for public trading on the open exchange.
If an index weighted companies by Total Market Cap, a company with a massive valuation but almost no tradable shares could falsely dictate the movement of the entire index. To prevent this, nearly all modern indices use a Free-Float methodology. They calculate a company's weight in the index by multiplying the share price only by the number of shares actually floating freely in the public market (excluding locked-up insider shares). This ensures that the index accurately represents liquid, tradable assets rather than theoretical illiquid wealth.
9. Actionable Strategy Guide: Building a Cap-Weighted Portfolio
To implement a robust, diversified strategy using market capitalization principles, investors should follow a systematic asset allocation framework. This prevents accidental overexposure to highly volatile sectors.
- Step 1: Establish the Core (Large-Cap Focus). Allocate 60% to 70% of your equity portfolio to a broad-market, cap-weighted Large-Cap index fund (such as one tracking the S&P 500). This provides the anchor for your portfolio, securing blue-chip stability, steady dividends, and lower baseline volatility.
- Step 2: Add Growth Engines (Mid-Cap Exposure). Allocate 15% to 20% to Mid-Cap equities. Mid-caps historically offer some of the best risk-adjusted returns, operating in the "sweet spot" where they are structurally sound but still possess significant runway for expansion.
- Step 3: Allocate Risk Capital (Small-Cap Tilt). Limit Small-Cap exposure to 5% to 15% of the portfolio. Due to their high bankruptcy rate and volatility, never stock-pick small caps unless you are a professional analyst. Instead, utilize a Small-Cap Value ETF to capture the historical premium of this asset class while diversifying away single-company failure risk.
- Step 4: Assess the Macro Environment. Rebalance these percentages dynamically. If the Federal Reserve signals aggressive rate cuts (quantitative easing), incrementally increase your Small-Cap weighting to capture the impending risk-on rally. If inflation spikes and rates rise, trim Small-Caps and rotate heavy into Mega-Cap safety.
- Step 5: Avoid the Micro-Cap Trap. Strictly avoid allocating any serious retirement capital into Micro-Caps or Nano-Caps (Penny Stocks). The lack of regulatory oversight, immense bid-ask spreads, and extreme vulnerability to manipulation make them unsuitable for long-term fundamental investing.
10. Frequently Asked Questions (FAQs)
Q: Does a stock split change a company's market capitalization?
No. A stock split (or a reverse stock split) is purely a cosmetic accounting maneuver. In a 2-for-1 split, the company issues one additional share for every share currently held, effectively doubling the outstanding share count. Simultaneously, the open market price of the stock is halved. Because market cap is (Price × Shares), the math perfectly balances out, resulting in zero change to the company's total valuation.
Q: What is a Cap-Weighted Index versus an Equal-Weighted Index?
In a Cap-Weighted index (like the S&P 500), companies with the largest market capitalizations have the most influence over the index's movement. A 5% move in Apple (a Mega-Cap) will move the index drastically more than a 5% move in a smaller company like Macy's. In an Equal-Weighted index, every company is assigned the exact same percentage weight, regardless of their market cap, giving smaller companies an equal voice in the index's performance.
Q: Can a company's market capitalization be lower than its cash on hand?
Yes, though it is rare and usually indicates a company in severe distress. If a company has $100 million in cash but is burning through $30 million a quarter with massive impending liabilities or lawsuits, the market may price the entire enterprise at only $50 million. Investors recognize that the cash will soon be incinerated by bad operations, driving the market cap below the company's book value.
Q: Why do professional investors look at "Enterprise Value" instead of just Market Cap?
Market capitalization only represents the equity (stock) value of a company. Enterprise Value (EV) is a more comprehensive metric for corporate takeovers because it accounts for debt. The formula is (Market Cap + Total Debt - Cash). If you buy a company, you must pay its market cap to the shareholders, but you also assume all its debt, while getting to pocket its cash. EV reveals the true economic cost of acquiring the business.
See also
- Loading related topics...