Stock Market Basics
The Engine of Global Capitalism and Wealth Creation
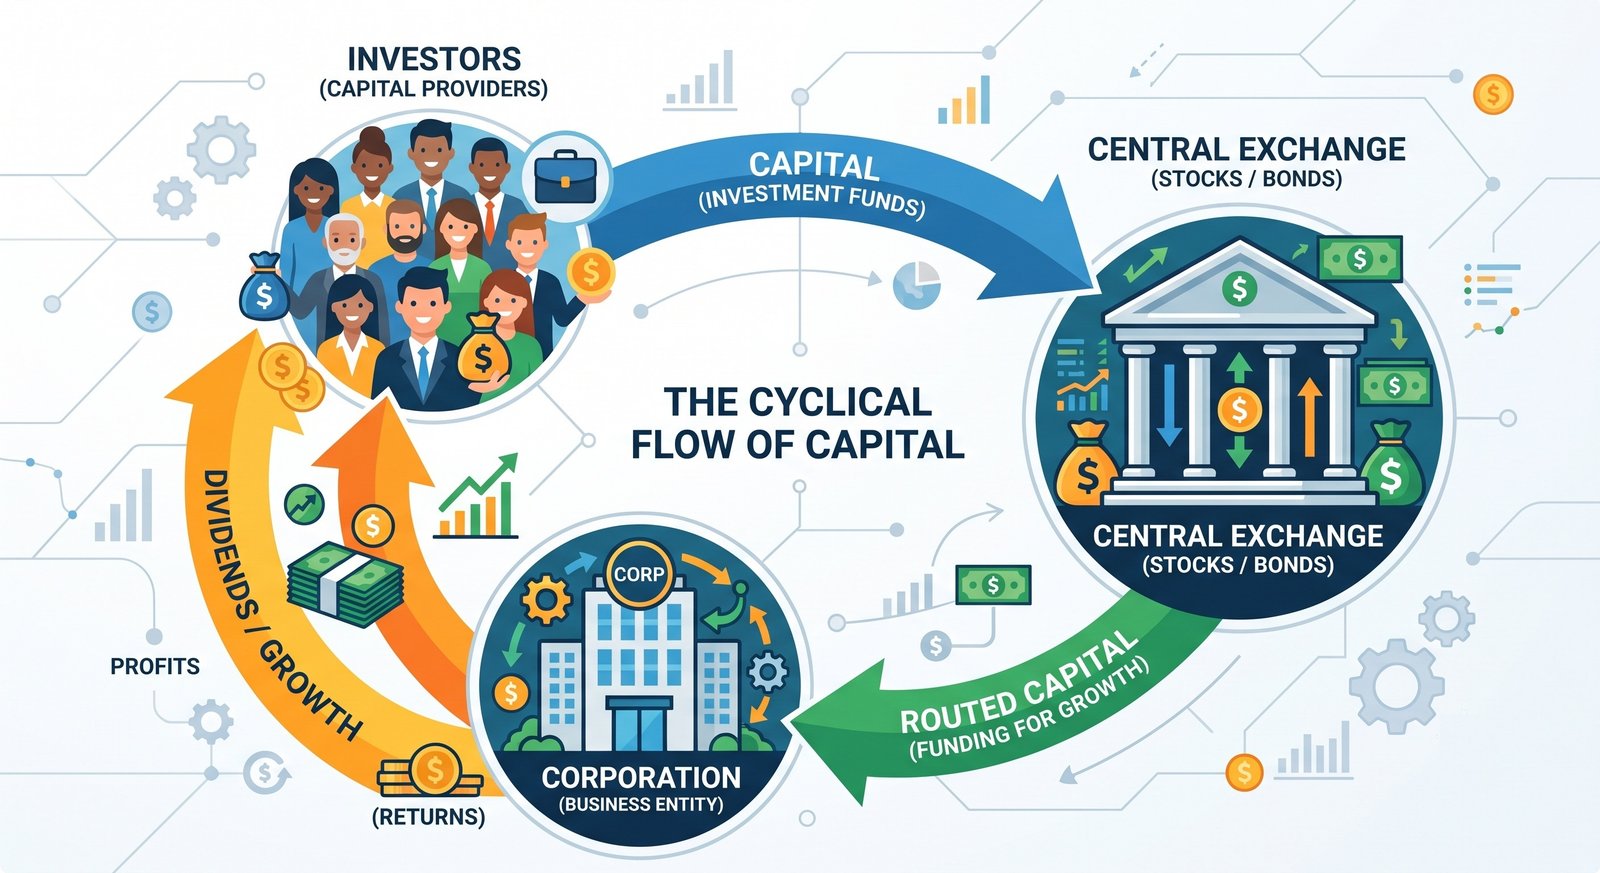
The stock market is a complex, globally interconnected network of exchanges and over-the-counter (OTC) markets where investors buy and sell shares of publicly traded companies. At its most fundamental level, the stock market serves a dual macroeconomic purpose: it acts as a primary capital formation mechanism for corporations seeking to fund expansion, research, or debt restructuring, while simultaneously democratizing wealth creation by allowing the general public to participate in the economic productivity and profit generation of the world's largest enterprises.
Tracing its conceptual origins back to the Dutch East India Company in 1602—which issued the first paper shares to finance highly risky, capital-intensive spice voyages—the modern stock market has evolved into a hyper-efficient, digitized ecosystem. Today, it processes trillions of dollars in transactional volume daily through advanced algorithmic routing, centralized clearinghouses, and highly regulated national exchanges such as the New York Stock Exchange (NYSE), the Nasdaq, the Bombay Stock Exchange (BSE), and the Tokyo Stock Exchange (TSE). Understanding the fundamental architecture, operational mechanics, and mathematical valuation frameworks of the stock market is the requisite first step for any individual embarking on a journey of long-term financial independence.
1. The Anatomy of a Share and Market Capitalization
A "share" (or "stock") represents a fractional ownership interest in a corporation. When an investor purchases a share, they are not merely trading a ticker symbol on a screen; they are legally acquiring a proportional claim on the underlying company's current assets and future cash flows, as well as obtaining voting rights on major corporate governance issues (in the case of common stock). However, a single share's price is entirely meaningless in isolation. The true measure of a company's financial footprint is its Market Capitalization.
Market Capitalization (or Market Cap) is the total aggregate value of all a company's outstanding shares. It dictates whether a company is classified as Large-Cap, Mid-Cap, or Small-Cap, which inherently influences the asset's risk profile and volatility.
$$Market\_Cap = P \times N$$
Where $P$ is the current price per share and $N$ is the total number of outstanding shares. For example, if Company A has 1 million shares priced at $100 each, its market cap is $100 million. If Company B has 10 million shares priced at $20 each, its market cap is $200 million. Despite having a lower share price, Company B is mathematically twice as large and twice as valuable as Company A.
2. Primary vs. Secondary Markets
The stock market is bifurcated into two distinct operational phases: the Primary Market and the Secondary Market.
- The Primary Market: This is where securities are created and sold to investors for the first time. The most notable event here is the Initial Public Offering (IPO). During an IPO, a private company enlists an investment bank (the underwriter) to evaluate its business, set an initial price, and sell blocks of newly created shares to institutional investors. The capital raised in the Primary Market goes directly to the company's treasury.
- The Secondary Market: Once the IPO is complete, the shares begin trading on public exchanges. This is the Secondary Market, and it is what most people refer to when they say "the stock market." In this ecosystem, investors trade shares among themselves. If you buy 100 shares of Microsoft today, Microsoft does not receive your money. You are buying those shares from another investor who is willing to sell them at the current market equilibrium price. The secondary market provides vital liquidity, ensuring investors can convert their ownership stakes into cash almost instantaneously.
3. Deep-Dive Explanations & Formulas: The Mechanics of Execution
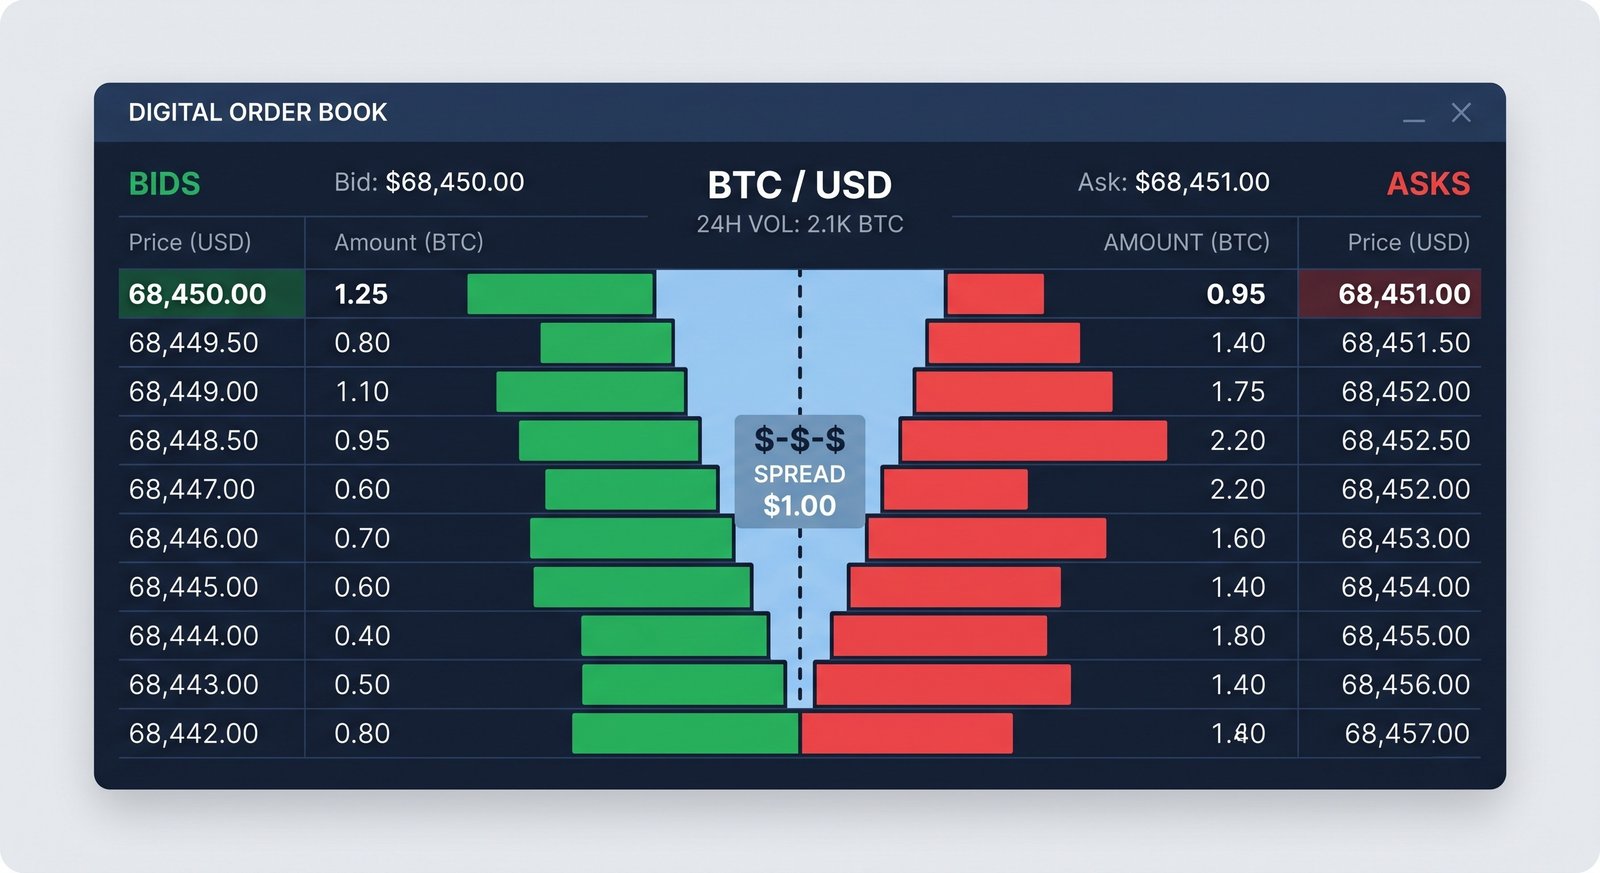
Trading in the secondary market operates via a continuous double-auction system. Prices are not arbitrarily set by the exchange; they are discovered in real-time through the collision of supply and demand, mediated by the Order Book. The order book tracks the highest price a buyer is willing to pay (the Bid) and the lowest price a seller is willing to accept (the Ask or Offer).
The difference between these two numbers is the Bid-Ask Spread, a critical measure of a stock's liquidity.
$$Spread = Ask\_Price - Bid\_Price$$
Highly liquid, large-cap stocks (like Apple) have spreads of merely a penny. Illiquid, micro-cap stocks may have spreads of several dollars, meaning an investor immediately loses significant value the moment they execute a trade due to this structural friction. To navigate this, investors use specific order types:
- Market Order: An instruction to buy or sell immediately at the best available current price. This guarantees execution but does not guarantee the price, making it dangerous in highly volatile or illiquid markets where the ask price might spike unexpectedly.
- Limit Order: An instruction to buy or sell a stock only at a specific price or better. A buy limit order can only be executed at the limit price or lower. This guarantees the price but does not guarantee execution (if the stock never reaches the limit price, the order remains unfilled).
4. Fundamental Valuation: Understanding Key Metrics
A stock price is a reflection of the market's forward-looking expectation of a company's future cash flows discounted back to the present day. To determine if a stock is fundamentally overvalued or undervalued, analysts rely on standard mathematical ratios.
Earnings Per Share (EPS): The portion of a company's profit allocated to each outstanding share of common stock. It is the purest indicator of profitability.
$$EPS = \frac{Net\_Income - Preferred\_Dividends}{Average\_Outstanding\_Shares}$$
Price-to-Earnings (P/E) Ratio: This compares the current stock price to its per-share earnings. A P/E of 20 means investors are willing to pay $20 for every $1 of current earnings. High P/E ratios suggest the market expects massive future growth (common in technology stocks), while low P/E ratios suggest a mature, slower-growing company (common in utilities or financials).
$$P/E\_Ratio = \frac{Price\_per\_Share}{EPS}$$
Dividend Yield: Many mature, profitable companies return excess cash directly to shareholders in the form of quarterly dividends. The dividend yield tells you the return on investment strictly from these cash payouts, ignoring potential stock price appreciation.
$$Dividend\_Yield = \frac{Annual\_Dividends\_per\_Share}{Price\_per\_Share} \times 100$$
5. Structured Comparison: Asset Classes and Vehicles
The stock market allows investors to acquire different types of assets, each carrying a distinct position on the capital structure hierarchy and risk spectrum. The table below outlines these foundational instruments.
| Asset Type | Risk / Volatility Profile | Key Characteristics & Rights |
|---|---|---|
| Common Stock | High Risk / High Return | Offers voting rights at shareholder meetings. Uncapped capital appreciation potential. Last in line for payouts during corporate bankruptcy. |
| Preferred Stock | Moderate Risk | Acts as a hybrid between a stock and a bond. No voting rights, but guarantees fixed dividend payments. Paid before common stockholders in liquidation. |
| Exchange-Traded Funds (ETFs) | Varies (Generally Lower Risk) | A single security that tracks a basket of underlying stocks (like an index). Provides immediate, low-cost diversification. Trades continuously like a stock. |
6. Realistic Case Studies
Theoretical concepts crystallize when observed through the lens of practical execution. The following edge-cases demonstrate how market mechanics affect investor outcomes.
- Case Study 1: The Liquidity Trap and Order Types
Profile: Julian is a novice investor who reads an article about a breakthrough medical device company, "NovaMed," which trades as a micro-cap stock on the OTC market.
The Scenario: NovaMed is highly illiquid. The order book shows a Bid price of $1.50 and an Ask price of $2.20 (a massive 31% spread). Ignoring order types, Julian places a "Market Order" to buy 5,000 shares. Because a market order demands immediate execution at any available price, Julian's broker buys the shares at the Ask price of $2.20, costing him $11,000. Immediately after execution, Julian checks his portfolio. Because his portfolio is valued based on the Bid price (what he could sell it for right now), his position is instantly valued at $1.50 per share ($7,500). Julian lost $3,500 the millisecond he placed the trade strictly due to the bid-ask spread and failing to use a Limit Order. - Case Study 2: The Power of Indexing and Compounding
Profile: Sarah, a 25-year-old teacher, acknowledges she lacks the time and expertise to dissect corporate balance sheets.
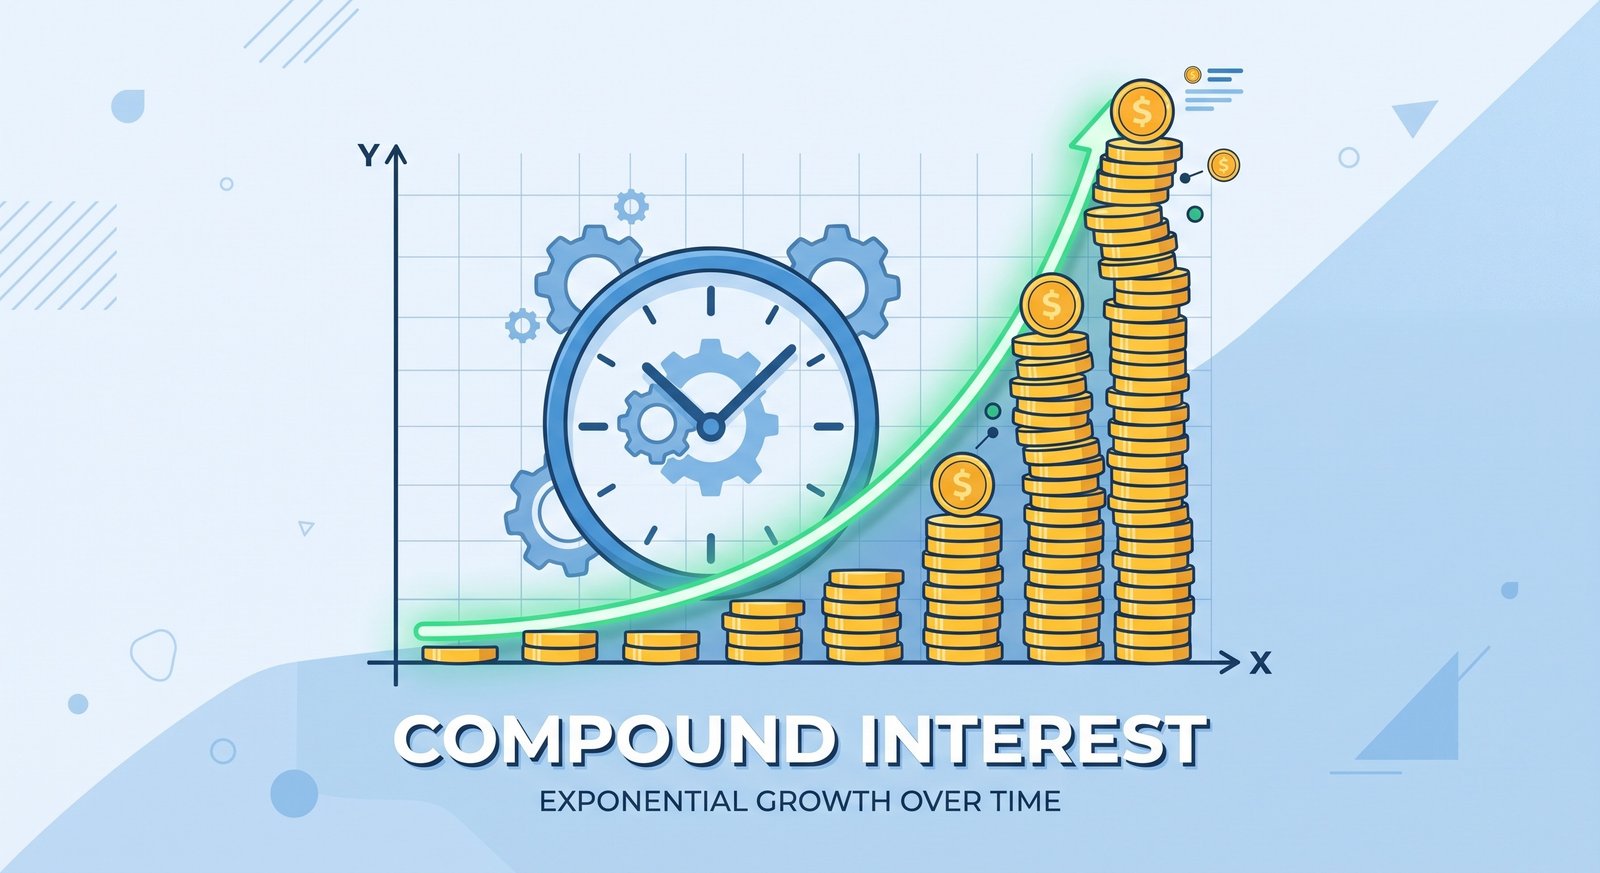
The Scenario: Instead of buying individual common stocks, Sarah buys an S&P 500 ETF, which holds the 500 largest US companies. She invests $500 every month systematically. She ignores daily volatility, political elections, and short-term economic recessions. Over 30 years, the broad market appreciates at an annualized rate of 8%, while also paying a 2% dividend yield that Sarah automatically reinvests (a 10% total compound annual growth rate). By the time she is 55, her total out-of-pocket contribution is $180,000. However, due to the geometric compounding of her ETF tracking the broader market's productivity, her portfolio's terminal value exceeds $1.1 million. This illustrates the market's primary function as an engine of long-term capital formation rather than a short-term casino.
7. Actionable Strategy Guide: Starting Safely in the Market
For a beginner, the sheer volume of data, flashing tickers, and financial jargon can be paralyzing. Follow this structured blueprint to safely initiate market participation while systematically mitigating risk.
- Step 1: Fortify Your Financial Base. The stock market is volatile. Never invest capital you will need within the next three to five years. Before buying a single share, ensure you have an emergency fund of 3-6 months' living expenses held in a highly liquid, risk-free vehicle (like a high-yield savings account or liquid mutual fund).
- Step 2: Open a Discount Brokerage Account. Select a heavily regulated, low-cost broker. Look for platforms that offer zero-commission equity trades and fractional shares. Ensure the account type aligns with your goals (e.g., a standard taxable account versus a tax-advantaged retirement account like an IRA or specific localized pension schemes).
- Step 3: Anchor with Broad-Market Index Funds. Do not attempt to pick individual "winning" stocks as a beginner. Allocate 80% to 90% of your initial capital into a low-cost, broad-market ETF (such as one tracking a major national index or an All-World index). This provides immediate, ultimate diversification, protecting you from the idiosyncratic risk of any single company going bankrupt.
- Step 4: Automate Your Contributions (Dollar-Cost Averaging). Set up an automatic transfer from your checking account to your brokerage account on the day you receive your salary. Purchase your chosen ETFs consistently every month, regardless of whether the news headlines are euphoric or terrifying. This eliminates the behavioral flaw of attempting to "time" the market.
- Step 5: Utilize Limit Orders for Individual Equities. If you choose to allocate a small, speculative portion of your portfolio (10% or less) to individual companies you believe in, always execute your trades using Limit Orders. This ensures you control your exact entry point and prevents you from being victimized by sudden bid-ask spread expansions during volatile trading sessions.
Frequently Asked Questions
Q: Is investing in the stock market basically just gambling?
No. Gambling is a zero-sum (or negative-sum) game defined strictly by mathematical probability against a house edge; wealth is merely transferred, not created. The stock market is a positive-sum environment rooted in macroeconomic growth. When you buy a stock, you own a piece of a business that engineers products, generates cash flow, and grows intrinsically over time, expanding the total pool of wealth for all participants.
Q: What happens to my shares if a company goes bankrupt?
If a corporation enters liquidation bankruptcy, its assets are sold off to pay its creditors in a strict legal order. Secured bondholders are paid first, followed by unsecured creditors, and then preferred stockholders. Common stockholders are at the absolute bottom of the capital structure hierarchy. In almost all liquidation events, the capital runs out before reaching common shareholders, meaning your shares become worthless. This is why diversification across hundreds of companies is mathematically essential.
Q: How much money do I need to start investing?
Historically, brokers required large minimum deposits and charged high fees per trade, making the market inaccessible to smaller investors. Today, thanks to zero-commission brokerages and the advent of "fractional shares" (the ability to buy a slice of a share rather than a whole unit), you can theoretically begin investing and building a diversified portfolio with as little as $5 or $10.
Q: Why do stock prices fluctuate wildly on a daily basis?
Daily fluctuations rarely reflect the actual intrinsic value of a company's underlying business operations changing. Instead, daily price action is driven by human emotion, algorithmic trading, macroeconomic news (like inflation reports or interest rate changes), and the mechanical ebb and flow of liquidity. Over the short term, the market acts like a voting machine driven by sentiment. Over the long term, it acts like a weighing machine driven by actual corporate earnings.
Q: What is the difference between an Index and an Index Fund?
An index (like the S&P 500) is merely a mathematical concept—a theoretical tracker or benchmark of a specific group of stocks used to measure the market's overall health. You cannot invest directly in a mathematical concept. An Index Fund (or ETF) is an actual financial product created by an investment company that takes investor cash and mechanically buys all the stocks listed in that index in their exact proportions, allowing you to track the index's performance in reality.
See also
- Loading related topics...