Value vs Growth Investing
1. Introduction: The Great Divide in Equity Valuation
The financial markets are broadly categorized by two dominant, frequently competing investment philosophies: Value Investing and Growth Investing. While both strategies share the ultimate objective of generating superior risk-adjusted returns and compounding wealth over time, they approach the concept of valuation, risk, and corporate lifecycles from diametrically opposed perspectives. This ideological divide has fueled decades of academic debate, shaped the construction of trillions of dollars in mutual funds, and dictated the ebb and flow of global capital across macroeconomic cycles.
Value investing is rooted in the meticulous, present-day analysis of a company's tangible assets and current cash flows, seeking to purchase securities at a demonstrative discount to their intrinsic value. It is the financial equivalent of buying a dollar for sixty cents. Growth investing, conversely, requires a visionary approach. It focuses on the future, identifying companies capable of compounding their revenues and earnings at rates significantly higher than the broader market, regardless of seemingly "expensive" current valuation multiples. Growth investors are willing to pay a premium today for absolute dominance tomorrow.

Understanding the mechanics, mathematical formulas, and historical precedents of both strategies is mandatory for any serious investor. A portfolio strictly isolated to one philosophy will inevitably suffer through brutal periods of underperformance, as macroeconomic regimes shift. By mastering both, investors can dynamically allocate capital, avoiding both the "Value Trap" of dying industries and the "Growth Trap" of euphoric tech bubbles.
2. The Core Philosophy of Value Investing
Pioneered in the 1930s by Benjamin Graham and David Dodd at Columbia Business School, and subsequently perfected by disciples like Warren Buffett and Seth Klarman, value investing operates on a core premise: the stock market is highly inefficient in the short term, but a perfectly rational weighing machine in the long term. Value investors believe that human emotion—specifically fear and panic—frequently drives the price of a stock significantly below its true, fundamental worth, creating a transient pricing mismatch.
The most vital concept in the value investor's arsenal is the Margin of Safety. Because calculating the exact intrinsic value of a business requires forecasting future cash flows (which involves inherent uncertainty), a value investor demands a massive discount. If an analyst determines a company is intrinsically worth $100 per share, they will not buy it for $95. They will wait until market pessimism drives the price down to $60 or $70. This 30-40% margin of safety acts as a shock absorber against calculation errors, sudden economic recessions, or unforeseen corporate mismanagement.
3. Deep-Dive Explanations & Formulas: The Metrics of Value
Value investors rely heavily on standardized accounting metrics to screen for discounted securities. They prefer businesses with steady, predictable cash flows, low debt, and tangible assets. The following formulas form the bedrock of value screening:
- Price-to-Earnings (P/E) Ratio: The most basic valuation multiple, comparing a company's current share price to its per-share earnings. Value investors generally seek companies trading at P/E ratios well below the broader market average (e.g., a P/E of 10x when the S&P 500 averages 18x).
Formula: P/E Ratio = Market Price per Share / Earnings per Share (EPS) - Price-to-Book (P/B) Ratio: This metric compares the market's valuation of a company to its Book Value (Total Assets minus Total Liabilities). A P/B ratio below 1.0 implies the market is valuing the company for less than the liquidation value of its physical assets—a classic Graham-style value signal.
Formula: P/B Ratio = Market Price per Share / Book Value per Share - Enterprise Value to EBITDA (EV/EBITDA): A highly preferred metric in modern value investing and private equity. Unlike P/E, this formula factors in a company's debt and cash, providing a more accurate picture of the total cost to acquire the business relative to its core operational cash flow. A ratio below 8x is traditionally considered "value" territory.
Formula: EV/EBITDA = (Market Cap + Total Debt - Cash) / Earnings Before Interest, Taxes, Depreciation, and Amortization - Discounted Cash Flow (DCF) Valuation: The ultimate absolute valuation model. It calculates intrinsic value by projecting all future free cash flows a company will ever produce and discounting them back to today's present value using a required rate of return (Discount Rate). If the current market price is lower than the DCF output, the stock is undervalued.
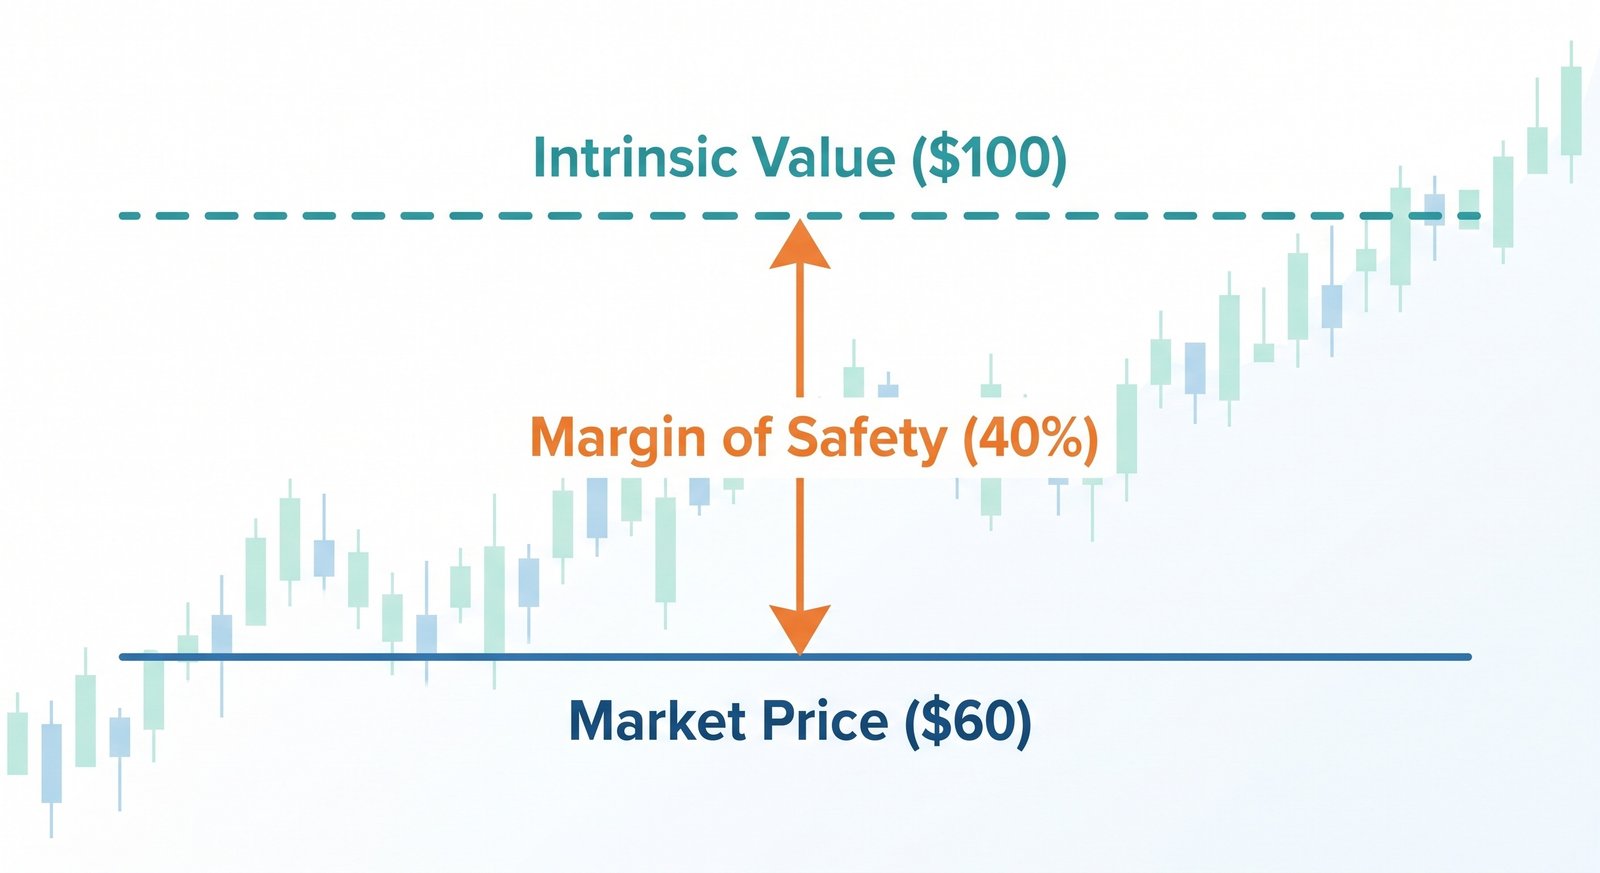
4. Case Study 1: The Value Investor's Triumph (Mean Reversion)
Let us examine a realistic value investing scenario to observe these principles in action. Consider Titan Manufacturing Corp, a 60-year-old fictional company that produces specialized industrial farming equipment. The global economy enters a mild recession, and agricultural commodity prices drop. Wall Street panics, assuming farming equipment sales will permanently stagnate.
Titan's stock price plummets from $85 to $35. At $35, the company's P/E ratio compresses to just 6x, and its P/B ratio falls to 0.8. A value investor, Sarah, runs a deep fundamental analysis. She notices that while short-term sales are indeed down 15%, Titan has absolutely zero long-term debt, $500 million in pure cash on the balance sheet, and a massive real estate portfolio consisting of fully paid-off factories that are carried on the books at 1980s prices.
Sarah calculates Titan's intrinsic value at $90 per share. At $35, she has a massive 61% Margin of Safety. She heavily buys the stock. Over the next two years, the economic cycle recovers. Farming equipment orders return to average historical levels. The market realizes its pricing error, and a phenomenon known as "mean reversion" occurs. The stock rapidly re-rates back to a normalized P/E of 14x, and the price surges to $95. Sarah realizes a nearly 170% return, not because Titan invented a revolutionary new technology, but simply because she bought tangible, boring assets at a drastic, irrational discount.
5. The Core Philosophy of Growth Investing
If value investing is about buying what is currently out of favor, Growth Investing is about identifying the unstoppable momentum of the future. Popularized by legendary investors like Philip Fisher and Thomas Rowe Price Jr., growth investing focuses on companies that are innovating, disrupting legacy industries, and expanding their Total Addressable Market (TAM) at blistering speeds.
Growth investors do not care if a stock looks "expensive" based on trailing twelve-month (TTM) earnings. In fact, many pure growth companies (like early-stage SaaS software or biotechnology firms) operate at massive net losses for years. The philosophy dictates that if a company can capture a monopoly-like market share, benefit from exponential network effects, and sustain 30%+ annual revenue growth, its future earnings will be so colossal that today's high entry price will eventually look like a profound bargain. Growth investing relies on the mathematical power of compound interest applied directly to corporate revenue lines.
6. Deep-Dive Explanations & Formulas: The Metrics of Growth
Because traditional value metrics (like P/E) are useless for companies with zero or negative net income, growth analysts rely on a different set of financial heuristics to determine if a high valuation is justified.
- Price/Earnings-to-Growth (PEG) Ratio: For profitable growth companies, this metric adjusts the P/E ratio based on the expected growth rate. A company with a high P/E of 50x is actually "cheap" if its earnings are growing at 70% a year (PEG = 0.71).
Formula: PEG Ratio = (P/E Ratio) / Annual EPS Growth Rate - Rule of 40 (For SaaS & Software): A specialized metric used to evaluate high-growth software companies. It dictates that a healthy software company's revenue growth rate plus its profit margin should equal or exceed 40%. This balances the trade-off between burning cash to acquire customers and generating profits.
Formula: Year-over-Year Revenue Growth % + EBITDA Margin % ≥ 40% - LTV to CAC Ratio: A critical metric for subscription-based growth businesses. It compares the Lifetime Value (LTV) of a customer to the Customer Acquisition Cost (CAC). An LTV:CAC ratio of 3:1 or higher indicates a highly efficient, scalable growth engine that justifies heavy upfront marketing spend.
- Price-to-Sales (P/S) Ratio: Used when a growth company has no earnings. It evaluates the stock price relative to top-line revenue generation. While a P/S of 2x is standard for traditional businesses, hyper-growth tech stocks often trade at P/S ratios of 10x to 30x, banking on future margin expansion.
Formula: P/S Ratio = Market Capitalization / Total Annual Revenue
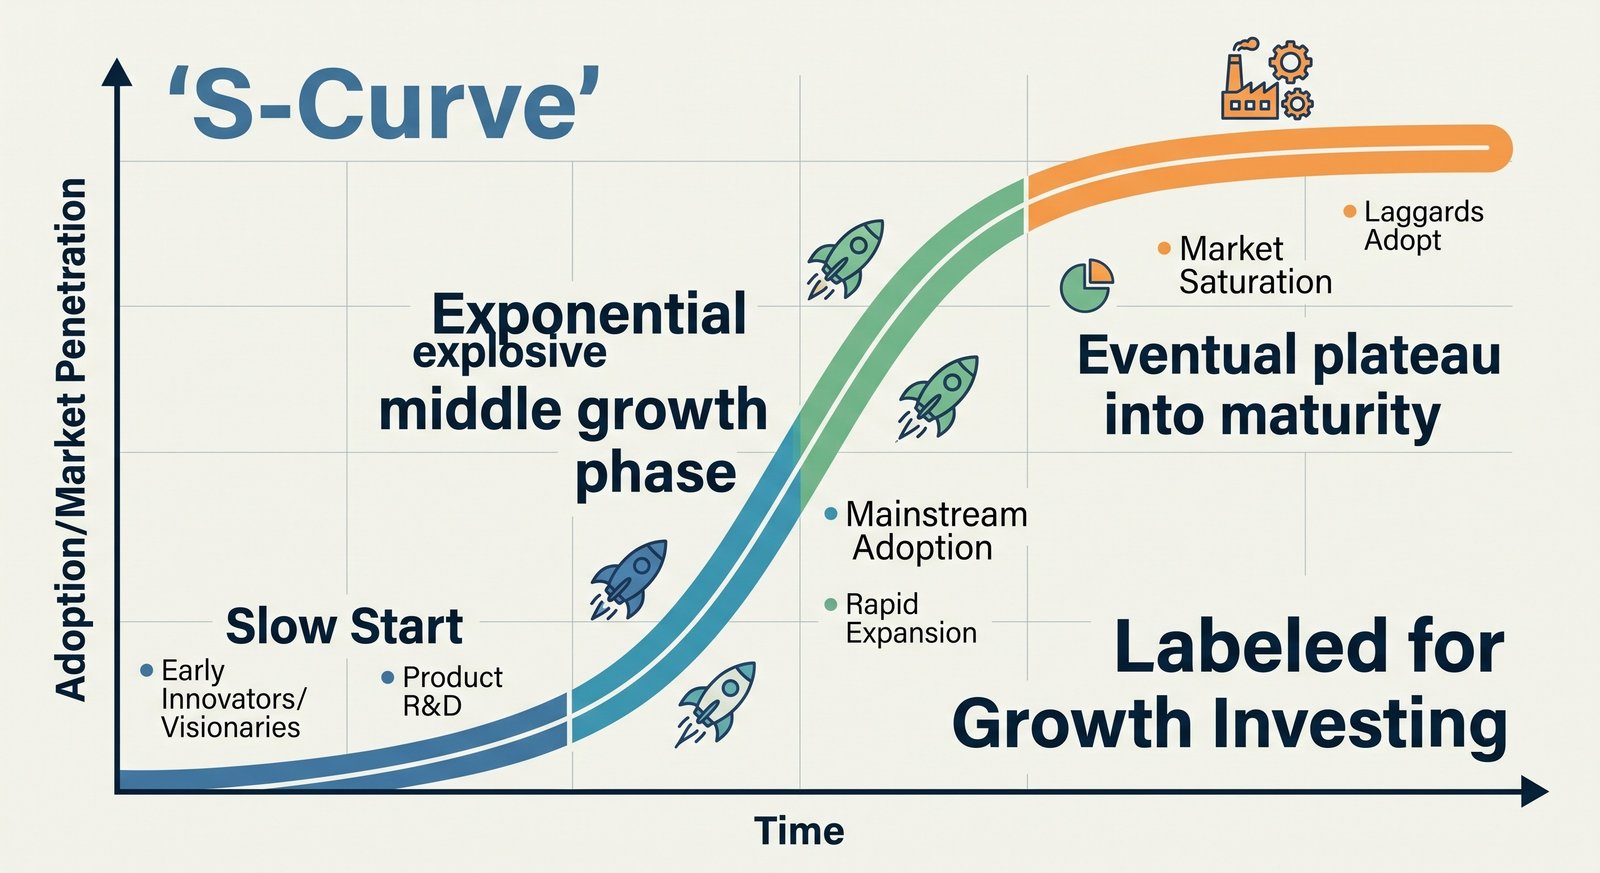
7. Case Study 2: The Growth Investor's Multi-Bagger
To understand the psychology of growth investing, consider the fictional enterprise software company CloudStream Networks. CloudStream has developed a revolutionary AI-driven cybersecurity protocol. They recently went public at $40 per share.
A traditional value investor looks at CloudStream and balks. The company is losing $50 million a year (negative EPS), pays no dividend, and trades at an astronomical Price-to-Sales ratio of 25x. However, a growth investor named David digs deeper. David notes that CloudStream's top-line revenue is growing at 85% year-over-year. More importantly, their gross margins are 80%, and their Gross Revenue Retention rate is 98%, meaning once a corporate client signs up, they almost never leave.
David realizes the company is only losing money because it is spending heavily on the Customer Acquisition Cost (CAC). David buys the stock at $40. Over the next five years, CloudStream captures 40% of the Fortune 500 market. As revenue scales from $100 million to $2 Billion, the company flips the switch from aggressive marketing to profitability. Because of the 80% gross margins, massive amounts of cash flow directly to the bottom line. The stock price eventually hits $350 per share. David secures an 800% return (an "8-bagger"), proving that paying a high initial premium is irrelevant if the company's compounding engine is strong enough.
8. Macroeconomic Mechanics: The Impact of Interest Rates
The eternal battle between Value and Growth is fiercely moderated by Central Bank monetary policy, specifically the risk-free interest rate (e.g., the U.S. 10-Year Treasury Yield). Understanding this macroeconomic lever is the secret to timing stylistic rotations.
Growth stocks are "Long-Duration" assets. Because growth companies generate the bulk of their massive cash flows many years in the future, their present valuations are highly sensitive to the discount rate used in financial models. When interest rates are cut to near zero, the discount rate plummets. Future cash flows become extremely valuable in today's terms, causing Growth stocks to experience massive valuation expansions (as seen in the 2010s and 2020/2021).
Value stocks are "Short-Duration" assets. Value companies (like banks, energy firms, and industrials) generate heavy, tangible cash flows today. When inflation strikes and Central Banks aggressively hike interest rates, the discount rate spikes, destroying the present value of far-off tech earnings. Capital violently rotates out of Growth and floods into Value stocks, which offer immediate dividends and low multiples that can withstand a higher cost of capital.
9. Structured Comparison: Value vs Growth at a Glance
To optimize portfolio construction, investors must understand the contrasting characteristics of both equity classes. The table below provides a rapid comparative analysis across key financial dimensions.
| Investment Trait | Value Investing | Growth Investing |
|---|---|---|
| Primary Objective | Capital preservation and steady income via mean reversion. | Aggressive capital appreciation via exponential revenue scaling. |
| Target Valuation Metrics | Low P/E, Low P/B, High Dividend Yield, Low EV/EBITDA. | High Revenue Growth YoY, Low PEG Ratio, High Gross Margins. |
| Typical Sectors | Financials, Energy, Industrials, Utilities, Consumer Staples. | Technology, Biotechnology, E-commerce, Cloud Computing. |
| Ideal Macro Environment | High Inflation, Rising Interest Rates, Economic Recovery. | Low Inflation, Low Interest Rates (QE), Technological shifts. |
| The Ultimate Risk | The Value Trap: Buying a cheap company that goes bankrupt. | Valuation Contraction: Buying an overpriced stock right before growth slows. |
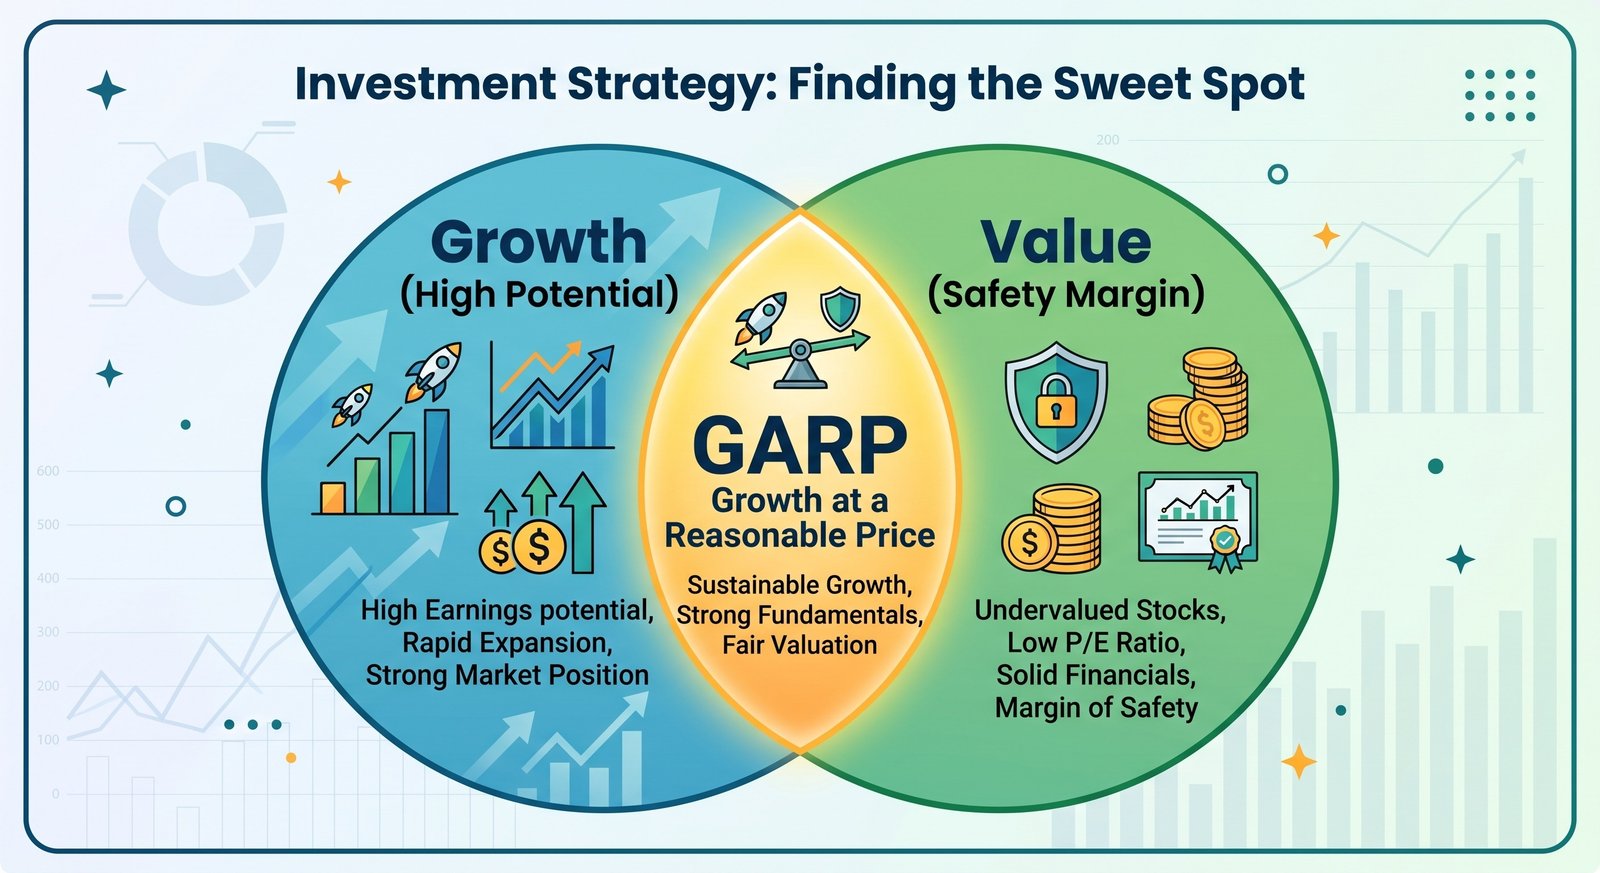
10. Advanced Strategies: The GARP Compromise
Investors are not strictly confined to being either Value purists or Growth maximalists. The most successful modern strategy is a hybrid known as GARP (Growth At a Reasonable Price), famously popularized by Peter Lynch during his legendary tenure at the Magellan Fund. GARP investors seek companies with solid, above-average earnings growth (typically 10% to 20% annually) but absolutely refuse to pay the stratospheric P/E multiples demanded by pure growth tech stocks.
The GARP strategy heavily utilizes the PEG ratio (keeping it near 1.0) and focuses on compounding wealth steadily. A classic GARP stock might be a highly successful healthcare conglomerate or a dominant consumer discretionary brand. It provides the downside protection of Value (through established earnings and reasonable multiples) with the compounding upside of Growth.
11. Actionable Strategy Guide: Constructing a Dual-Tilt "Barbell" Portfolio
Relying entirely on one investment style leaves an investor vulnerable to decade-long periods of underperformance. To build a robust, all-weather portfolio, implement the "Barbell Strategy" by following these steps:
- Step 1: Establish the Anchor (50%). Allocate half of your equity portfolio to a low-cost, broad-market index fund (e.g., S&P 500 or Total World Stock Index). This naturally blends Growth and Value at their current market-cap weightings, ensuring you capture baseline economic growth.
- Step 2: Load the Value Tilt (25%). Allocate 25% of your capital to a dedicated Value ETF or a hand-picked basket of robust, dividend-paying companies trading below historical P/E averages. Focus on sectors like Financials and Energy. This side of the barbell protects you during inflation shocks and bear markets.
- Step 3: Load the Growth Tilt (25%). Allocate the remaining 25% to high-conviction Growth vectors. This can be a Nasdaq 100 ETF, or individual secular growth leaders in cloud computing, AI, or biotech. This side of the barbell drives exponential alpha during low-rate, risk-on environments.
- Step 4: Implement Dynamic Rebalancing. Set a rigid rebalancing schedule (e.g., annually). If Growth goes on a massive multi-year run and balloons to 40% of your portfolio, sell the excess and use the profits to buy the underperforming Value assets at a discount. This forces you to "buy low and sell high" systematically.
- Step 5: Monitor the Yield Curve. Watch the macroeconomic indicators. If the yield curve steeply un-inverts and the Federal Reserve begins aggressively slashing rates, expect Growth to outperform. If inflation proves sticky and rates remain "higher for longer," lean slightly heavier into your Value allocations.
12. Frequently Asked Questions (FAQs)
Q: Is Warren Buffett considered a Value or Growth investor?
While widely known as the world's most famous Value investor (having studied under Benjamin Graham), Buffett evolved over time, heavily influenced by his partner Charlie Munger. Buffett shifted from strictly buying "cigar butt" cheap stocks to a GARP approach, famously stating, "It's far better to buy a wonderful company at a fair price than a fair company at a wonderful price." His massive, highly successful investment in Apple exemplifies this evolution.
Q: What exactly is a "Value Trap"?
A value trap occurs when a stock looks incredibly cheap based on metrics (e.g., a P/E of 5, a massive dividend yield) but is actually facing structural, terminal decline. Examples include blockbuster video rental stores facing the dawn of streaming, or heavily indebted legacy mall retailers facing e-commerce disruption. The stock is cheap for a valid reason: the earnings are permanently disappearing.
Q: How do dividends fit into the Growth vs Value debate?
Dividends are overwhelmingly a feature of Value investing. Value companies are typically mature and generate more cash than they can usefully reinvest into operations, so they return it to shareholders. Pure Growth companies almost never pay dividends; their management argues that returning cash to investors is inefficient when that cash could be reinvested into R&D or customer acquisition at a 30%+ internal rate of return.
Q: Can a Growth stock eventually become a Value stock?
Yes, this is the natural lifecycle of almost all successful corporations. Microsoft and Cisco were explosive, high-P/E Growth stocks in the 1990s. As they saturated their markets and matured into the 2010s, their growth slowed to GDP levels, their multiples contracted, they began paying hefty dividends, and they transitioned into classic Value/GARP territory.
Q: Why do rising interest rates crush Growth stocks more than Value stocks?
It is purely mathematical. Valuations are based on discounting future cash flows. Value stocks produce heavy cash flows right now, in the near term. Growth stocks have their massive cash flows projected 5, 10, or 15 years in the future. When the discount rate (interest rate) rises, the mathematical penalty applied to far-off future cash flows is exponentially more severe than the penalty applied to cash generated today. Thus, Growth valuations compress violently.
See also
- Loading related topics...